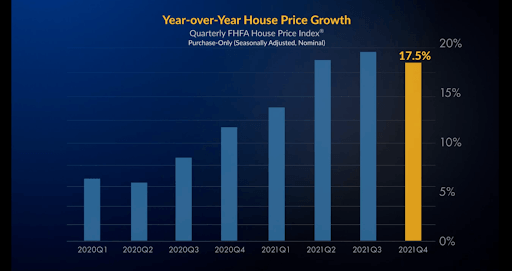
PRICE APPRECIATION
If we look at the big picture, US house prices rose 18.3% on average from May 2021 to May 2022. The 1st Quarter, 2022, marked the 41st straight quarter of positive price appreciation. We have not seen a negative price change in over a decade, since 2012.
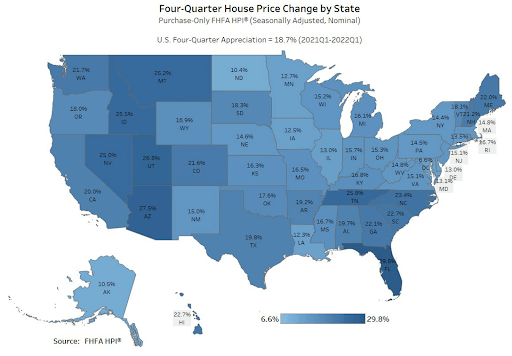
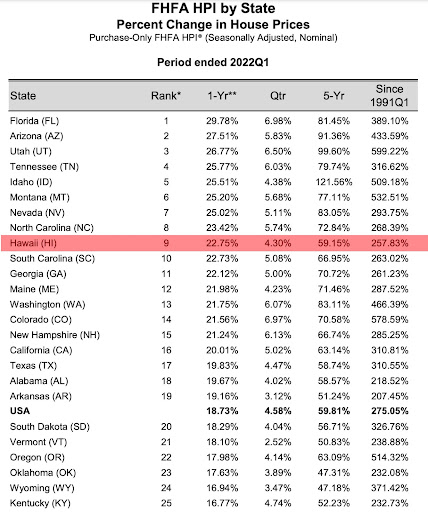
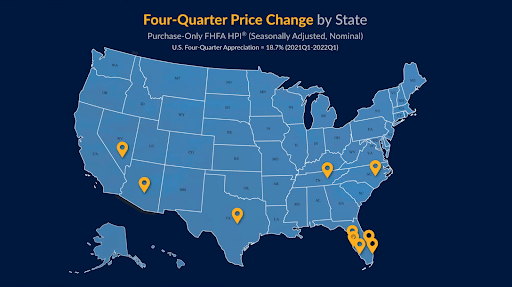
PRICE CHANGE BY STATE
All 50 states saw price appreciation in the 1st quarter.
The state of Hawaii is ranked 9th, with a 22.75% appreciation.
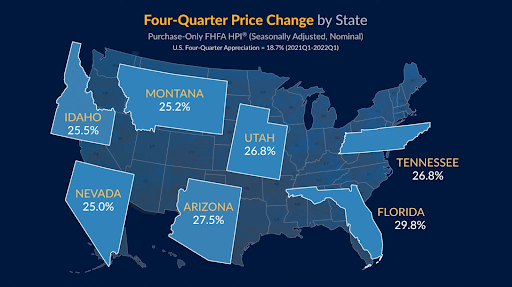
Florida & Arizona lead the nation with nearly 30% & 28% price appreciation, respectively (FHFA.gov).
PRICE CHANGE BY CITY
The City and County of Honolulu is up almost 18%, year over year. Honolulu is ranked in the top 100 cities in the nation after cities like, #1, Cape Coral-Fort Myers, FL, up 41% and #2, North Port-Sarasota-Bradenton, FL, up 35% (FHFA.gov). The Mountain Region has typically led the price appreciation charge. Elevated activity in the states with the prosperous economies of Texas, Tennessee, North Carolina & No.1, Florida.
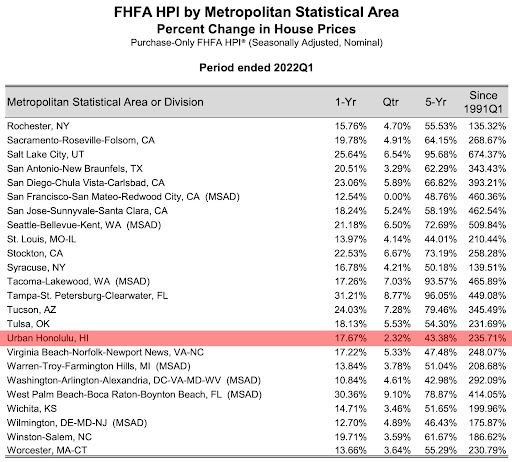
Five of the top 10 cities, in price appreciation, were in Florida.
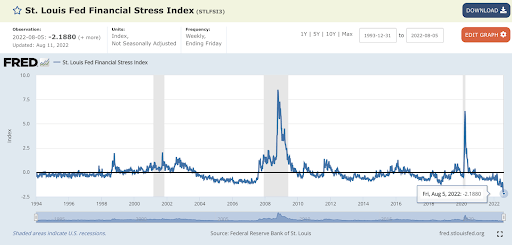
FINANCIAL STRESS INDEX
The nation’s Financial Stress Index on August 5th, 2022 was -2.188 points. The lowest it has been in decades. This number is way down from our last two recessions highlighted in gray. Where the index was at 5.48 points on March 20th, 2020, and nearly 9 points during the financial meltdown of 2008.
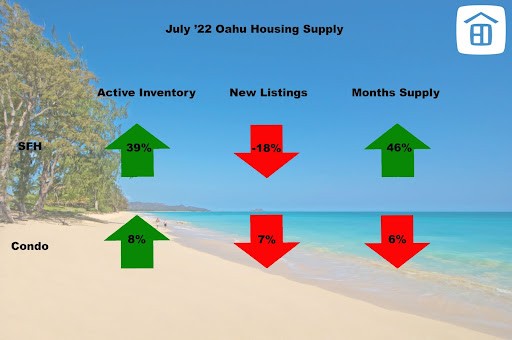
MONTHS SUPPLY
In July, 2022, the supply indicators were mixed. The figures where Single Family Homes jumped 39% in active listings and 46% in months supply, need to be taken with a grain of salt, because these numbers are being compared to July 2021, which is by far the greatest year in real estate history. It is also important to note, that months supply is still ridiculously low at just above ~1.5 month of supply. 6 months is considered a balanced market. Anything below that is a “seller’s market.”
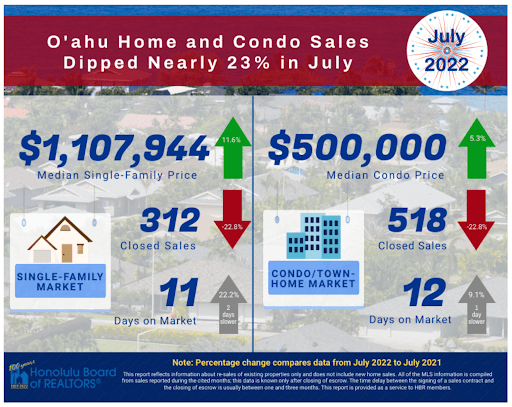
SALES VOLUME – July 2022
Median sales prices continue to move up, sales volumes are off 22% over last year and days on market is creeping up, but still super low… less than two weeks to sell property.
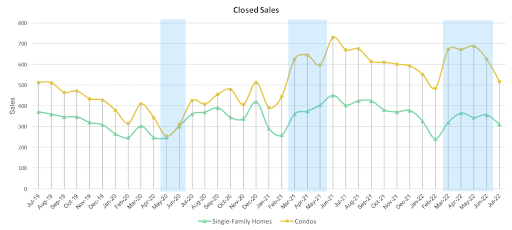
Traditionally, we see the closing volume of single family homes and condominiums move in lockstep with each other. When covid hit in the Spring of 2020, we saw a sharp decline in the closings and demand for condominiums (highlighted in blue). Perhaps, largely attributable to the desire for people to not have shared HVAC systems, common amenities & shared elevators. This was the first time in recorded Hawaii real estate history, where we witnessed the “decoupling” of single family homes and condominiums. We can see further highlighted examples, where closings are moving independently of each other.
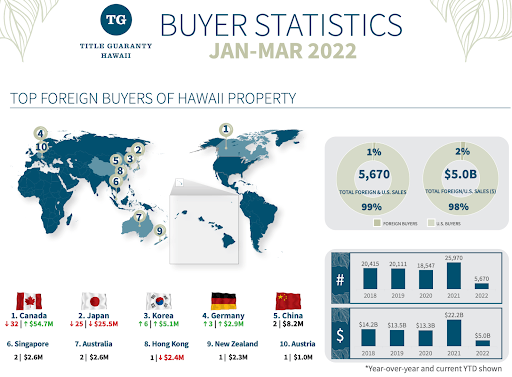
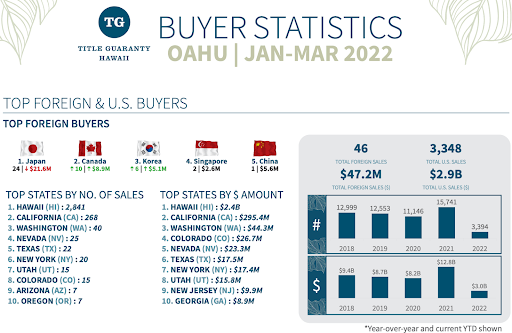
WHO IS BUYING HAWAII REAL ESTATE?
For the entire state of Hawaii, nearly 5,700, or $5B, of real estate transactions occurred in the first quarter of 2022. Fully 75% of the buyers were Hawaii Residents. The next largest group of buyers were from California, at nearly 11%. Canada & Japan were the top foreign buyers, totaling about $80M over 57 sales.
On Oahu, fully 84% of the transactions were Hawaii resident buyers. The next largest total of purchases came from California, at 8%. Japan is the number one foreign investor on Oahu. 96% of Japanese investment occurs on Oahu.
PRICE GROWTH
The market remains hot and the rate of price growth has been hovering around 20% for several quarters. In the first half of 2020, we saw above average growth levels at around 5-6%. In the second half of 2020, we saw border closings and supply chain issues. These issues impacted construction and renovations, which pushed up prices for real estate. In 2021, we saw 50 year low mortgage rates that caused intense demand. Couple this intense demand with low supply, and it is no wonder that Q3 2021, saw double digit gains in all 50 states and the District of Columbia. (Source FHFA)
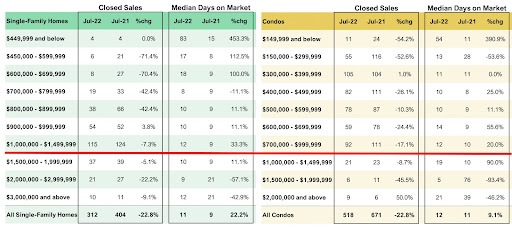
PRICE POINTS
For single-family homes, we see a sweet spot from $1-1.5M, where the predominant amount of closings are occurring. For condominiums (yellow chart), we can see a sweet spot at $700-999k. The number of closings decrease beyond that, as DOM increases.
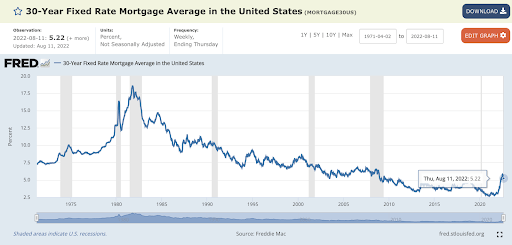
INTEREST RATES
Interest rates hit a 50 year low in January 2021, of 2.65%. Since then, on June 16, interest rates have more than doubled to 5.78%, on average. Interest rates have been a W-shaped bounce-a-thon since then and were hovering at 5.22%, on 8/11/22.
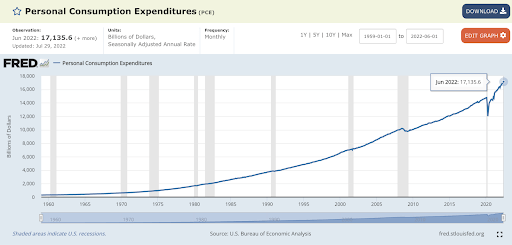
INFLATION
Personal Consumption Expenditures is up nearly 43%, since the onset of Covid.
Inflation, Consumer prices index is up 11% since COVID.
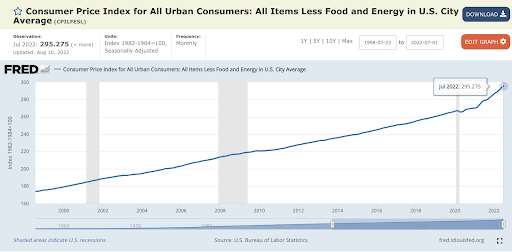
Owning real estate is a good hedge against inflation.
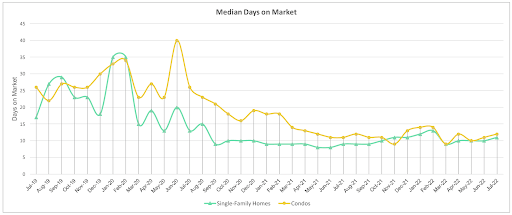
DAYS ON MARKET (Velocity)
Days on market is a good measure of “market velocity” or how quickly homes are selling. In July, market velocity for single family homes and condominiums were 11 & 12 days, respectively (a week and a half to sell property!). This is 22% slower for single family homes, but 9% slower for condos.
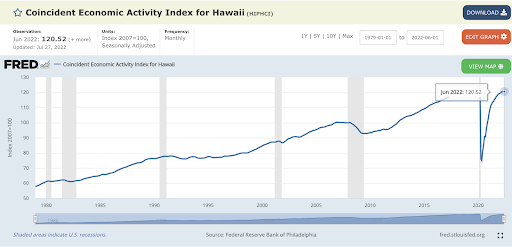
ECONOMIC ACTIVITY
The line in the graph represents an index that tracks Hawaii’s economic activity. We can see the last 6 US recessions highlighted in gray. Since November of 2019, the index dropped 39%. In July, we were back within a several points of Pre-Covid, all time highs.
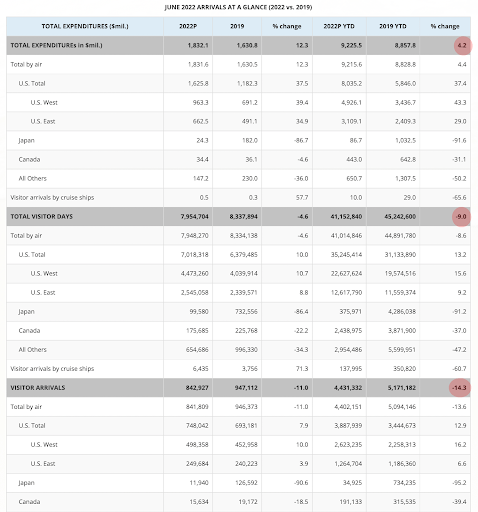
VISITOR Spending, Days & Arrivals
Visitor expenditures thru June, 2022, were +4.2% higher than the same period, 2019.
Visitor Days are within ~9% of pre Covid numbers.
Visitor Arrivals ~15% lower than pre Covid.
These statistics may find pre covid numbers when foreign travel starts to ramp up shortly.
SUMMARY for July 2022
In summary, prices reach record highs for both categories as a result of continued low supply and high demand. Demand takes a hit as interest rates more than doubled in the past 17 months. This increase in interest rate may have been causing Single family homes to show continued signs of slowing with a 23% lower closing volume and a 22% increase in days on market in June. Condo closing volume is down 22% and days on market is up 9%. Supply indicators are mixed, but overall remain historically low. US Mainland and International buyer investment is up and should continue to increase with international travel opening up. Market velocity is at 11 to 12 days to sell property and Hawaii’s economy continues to recover with lifted Covid mandates.
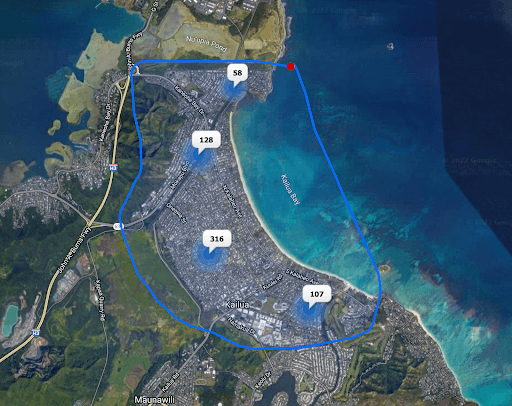
Kailua Neighborhood Spotlight
Did some charts on the last 2 years of data for the 609 listings in the Kailua area, non-waterfront and <$5M houses.
In 2021, there were 179 homes sold (blue), 28 were for sale at the end of the year (green) and 19 homes did not sell (expired, withdrawn, etc). An average of 14.9 homes sold per month. There were 1.9 months of supply on the market. These numbers gave Kailua home sellers a 79% odds of selling.
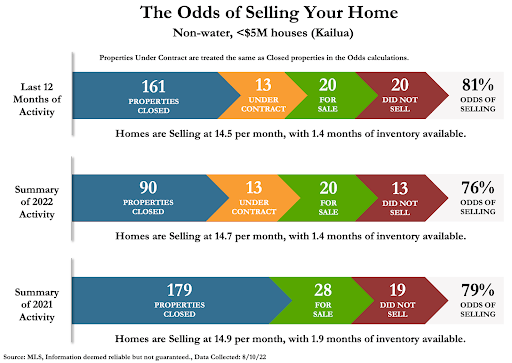
So far in 2022, there have been 90 closings (blue), there are 13 homes under contract (orange), there are 20 activite listings (green) and 13 homes have not sold this year (red). Homes are selling at 14.7 per month (~unchanged) and there are 1.9 months of inventory on the market (26% decrease). These numbers give us a 76% odds of selling.
6 months of inventory is considered a “balanced market.” Less than 6 months is considered a seller’s market and above 6 months is considered a buyer’s market.
So in supply and “odds of selling” terms, still very much a seller’s market.
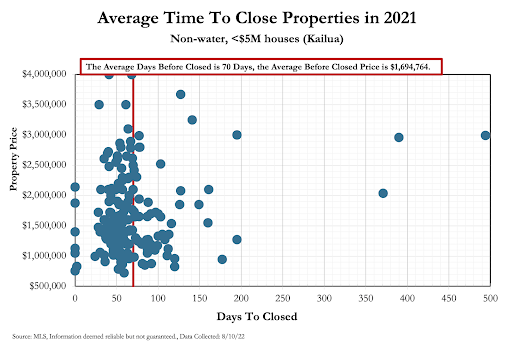
In 2021, it took an average of 70 days to close a property for an average price of ~$1.69M.
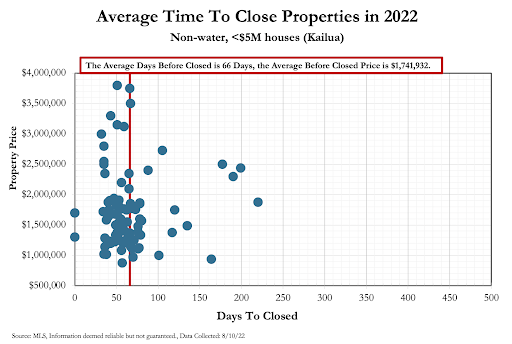
In 2022, it has taken 66 days (6% decreases) to close a property for an average of ~$1.74M (3% increase).
These two charts show us the distribution of closings that have occurred in Kailua in the past 2 years. In 2021, we saw a typical Spring and Summer Selling Season. But also, very consistent activity throughout the year. Uninterrupted by the typical breaks in the school year and travel/party plans usually associated with the 4th quarter.
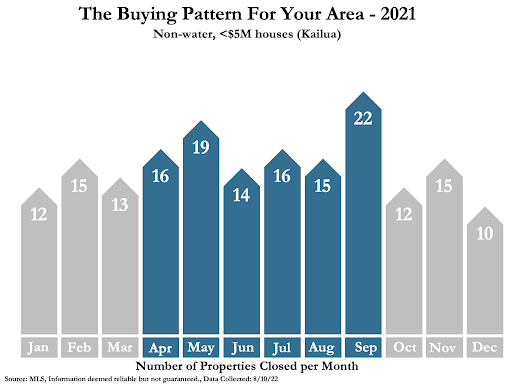
In 2022, we see continued double digit closings per month, with a drop off in March.

Each dot in this chart represents a closing in the past three months. The line tries to show the relationship between price and square footage.
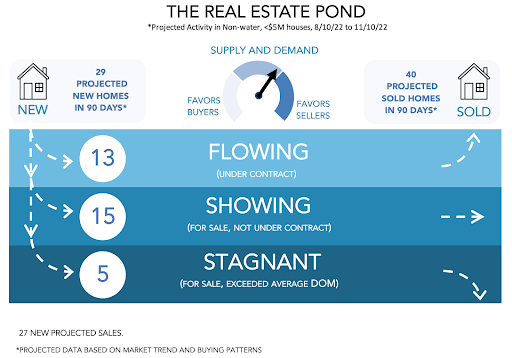
This chart takes the last two years of data and tries to predict the market activity for the next 90 days. It is predicted that we will see 29 new homes come on the market and we will see 40 sales occur.
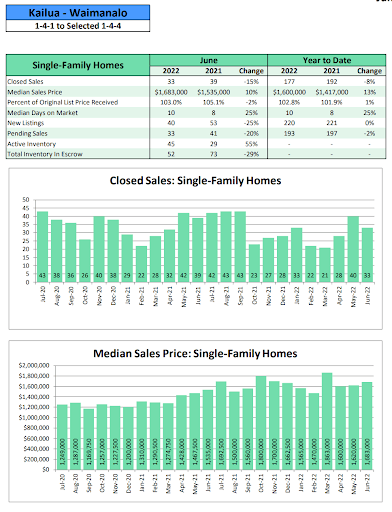
June 2022 data for Kailua-Waimanalo:

Cherie Tsukamoto
August 29, 2022
Great work, Jake! Lots of interesting data. Very useful and informative – thank you!
Cherie Tsukamoto
August 29, 2022
Great work, Jake! Lots of interesting data. Very useful and informative.