As it is my commitment to keeping the local community informed, I am pleased to share with you the most recent West Maui home, land, and condo sales reports for your review — covering Kaanapali, Kapalua, Lahaina, and Launiupoko. You’ll find real estate sales volume, days on market, list versus sold price, price per square foot, and significantly more.
West Maui July 2020 Headlines
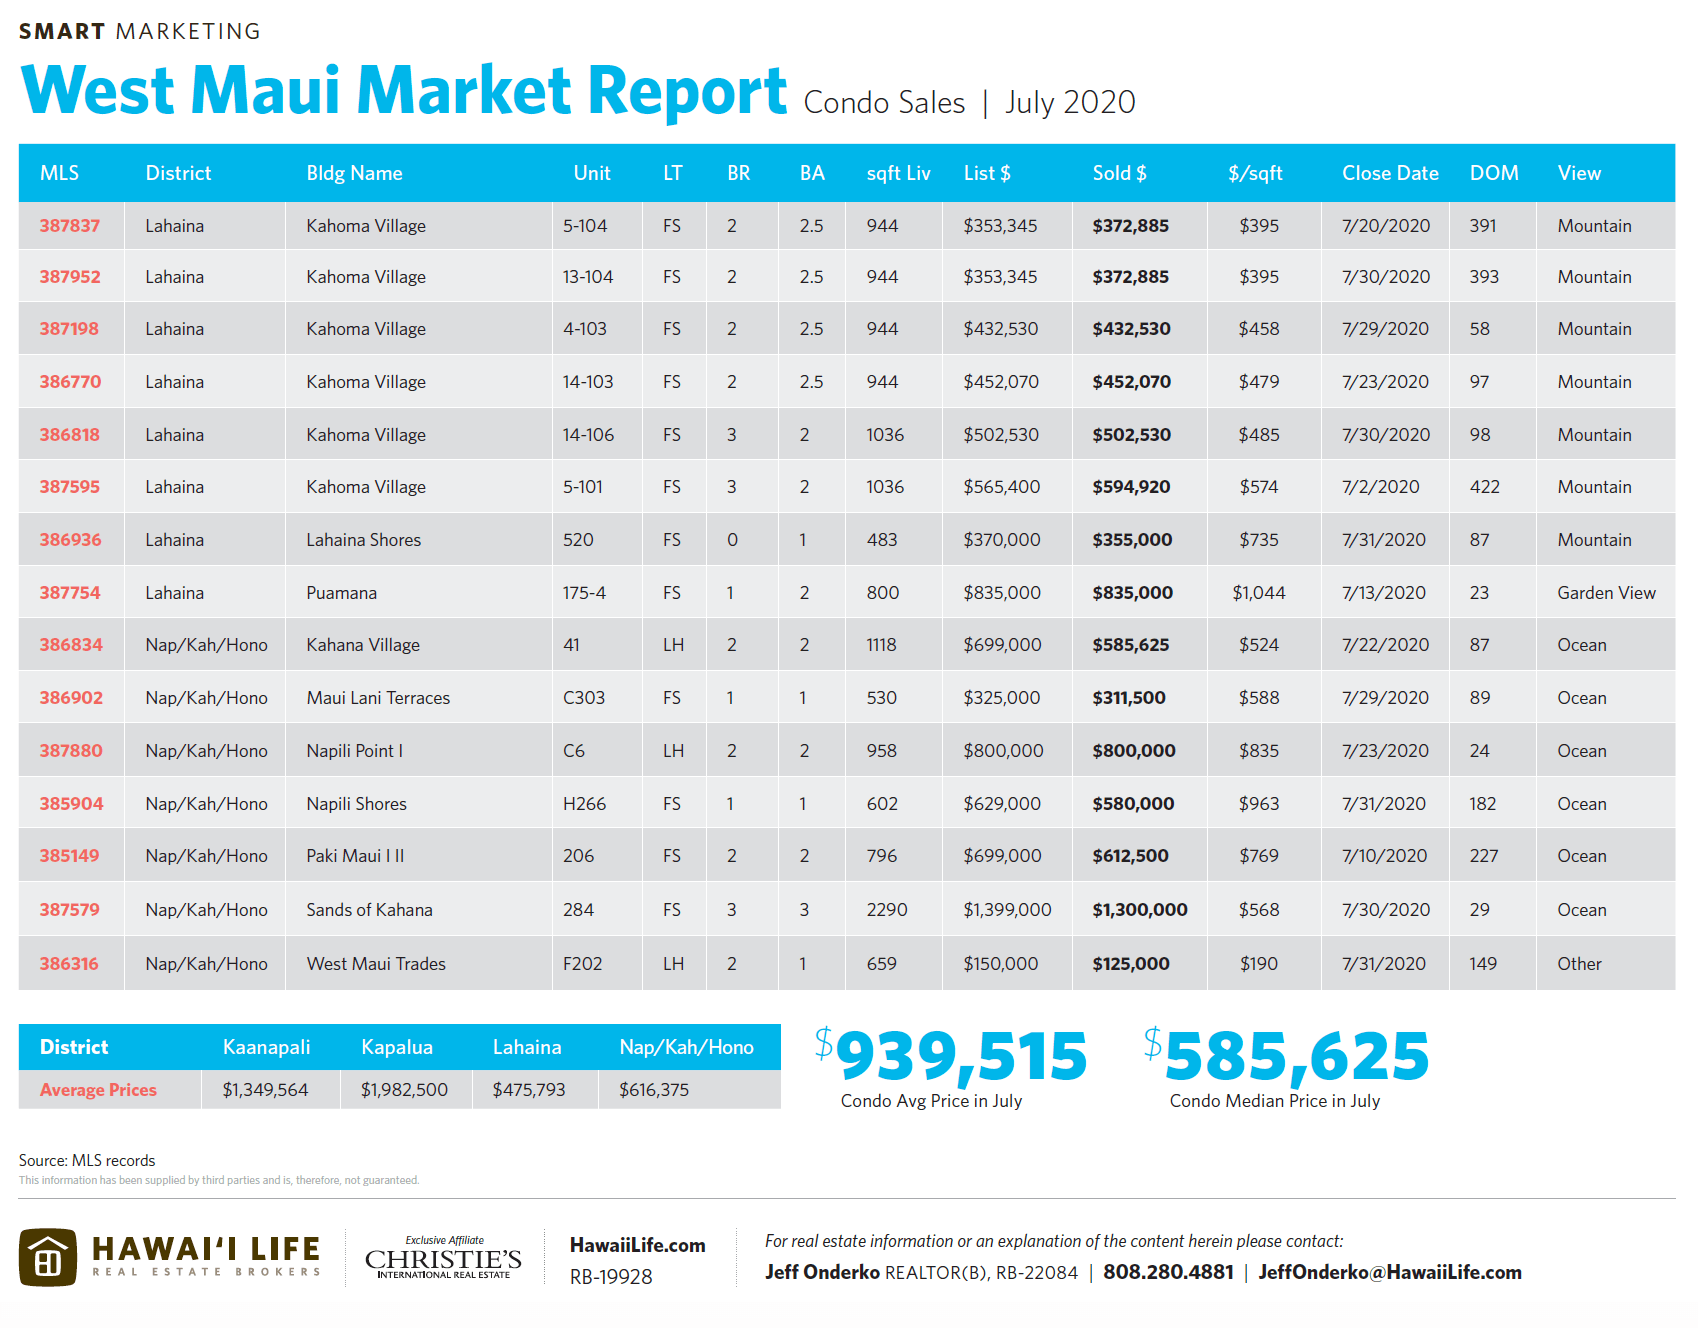
For further details on any of the statements below, please refer to the sales reports.
-
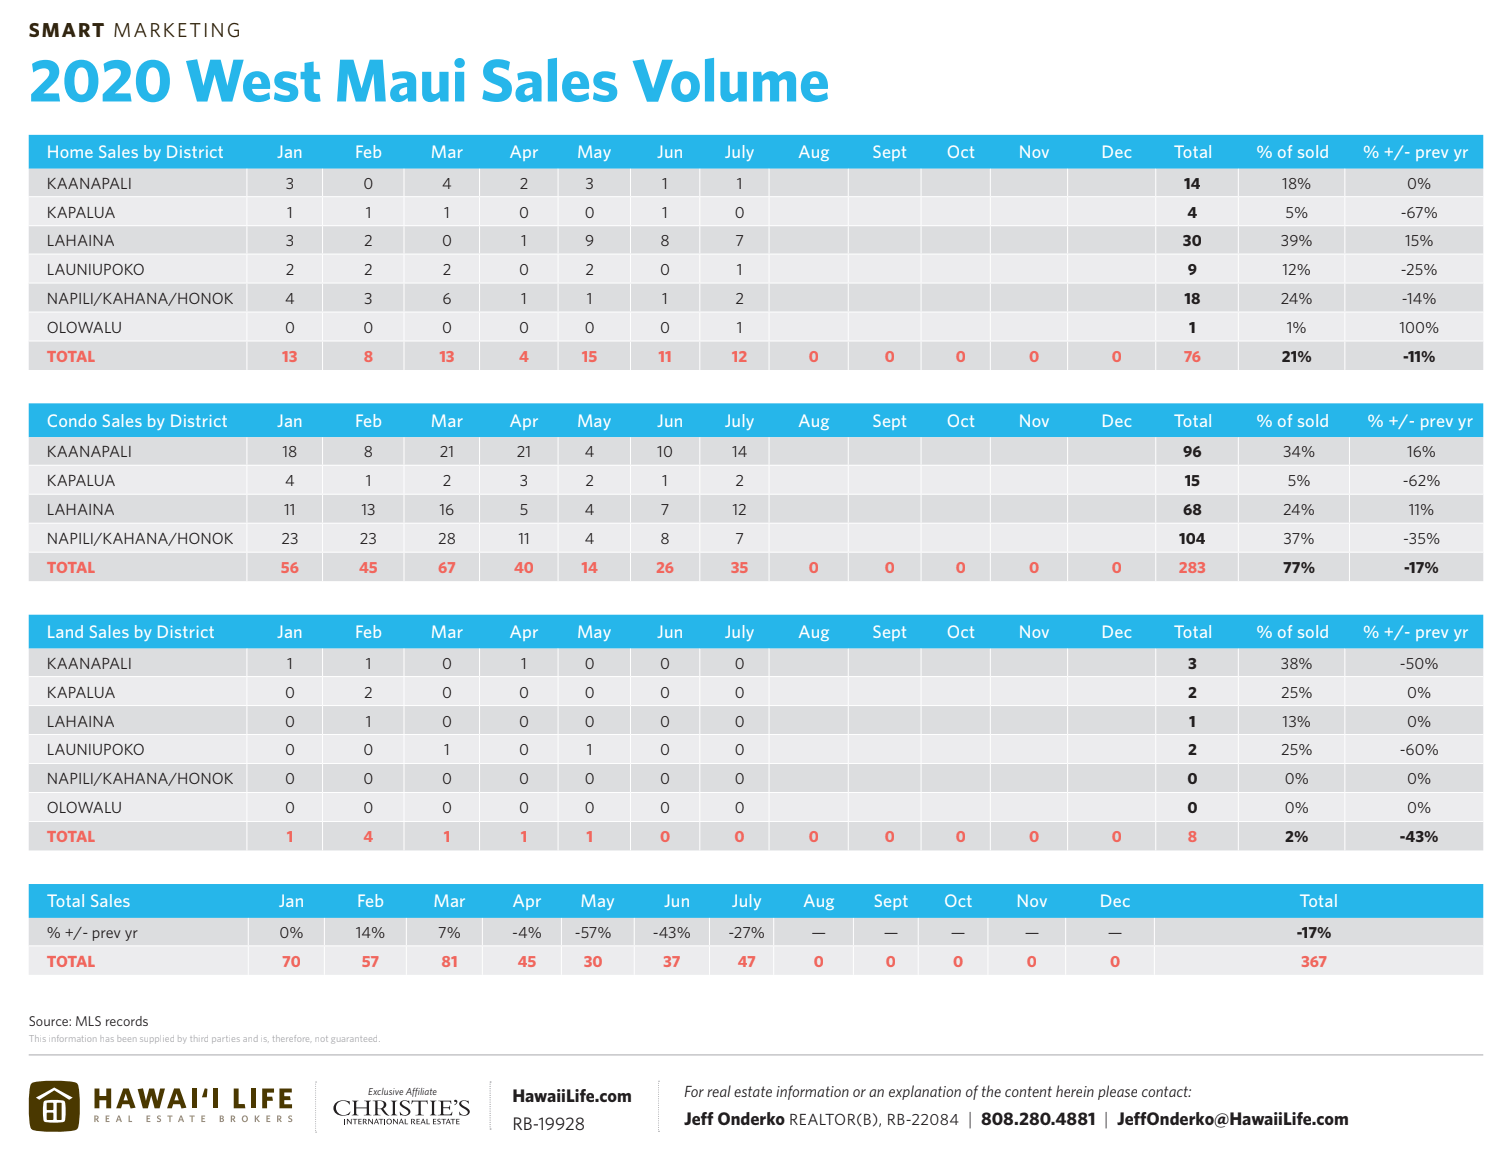
47 sales in July | Highest total since February
-
New Development a Key for Sales Volume as Kaanapali’s Luana Kai and Lahaina’s Kahoma Village made up 25% of all West Maui July sales.
-
Overall WM market is -17% thus far $1M+ market is only down 2% (year over year sales)
-
The Kaanapali vacation condo market showing signs of life. 14 more sales in July. Kaanapali condo market up 16% in 2020 (seriously).
-
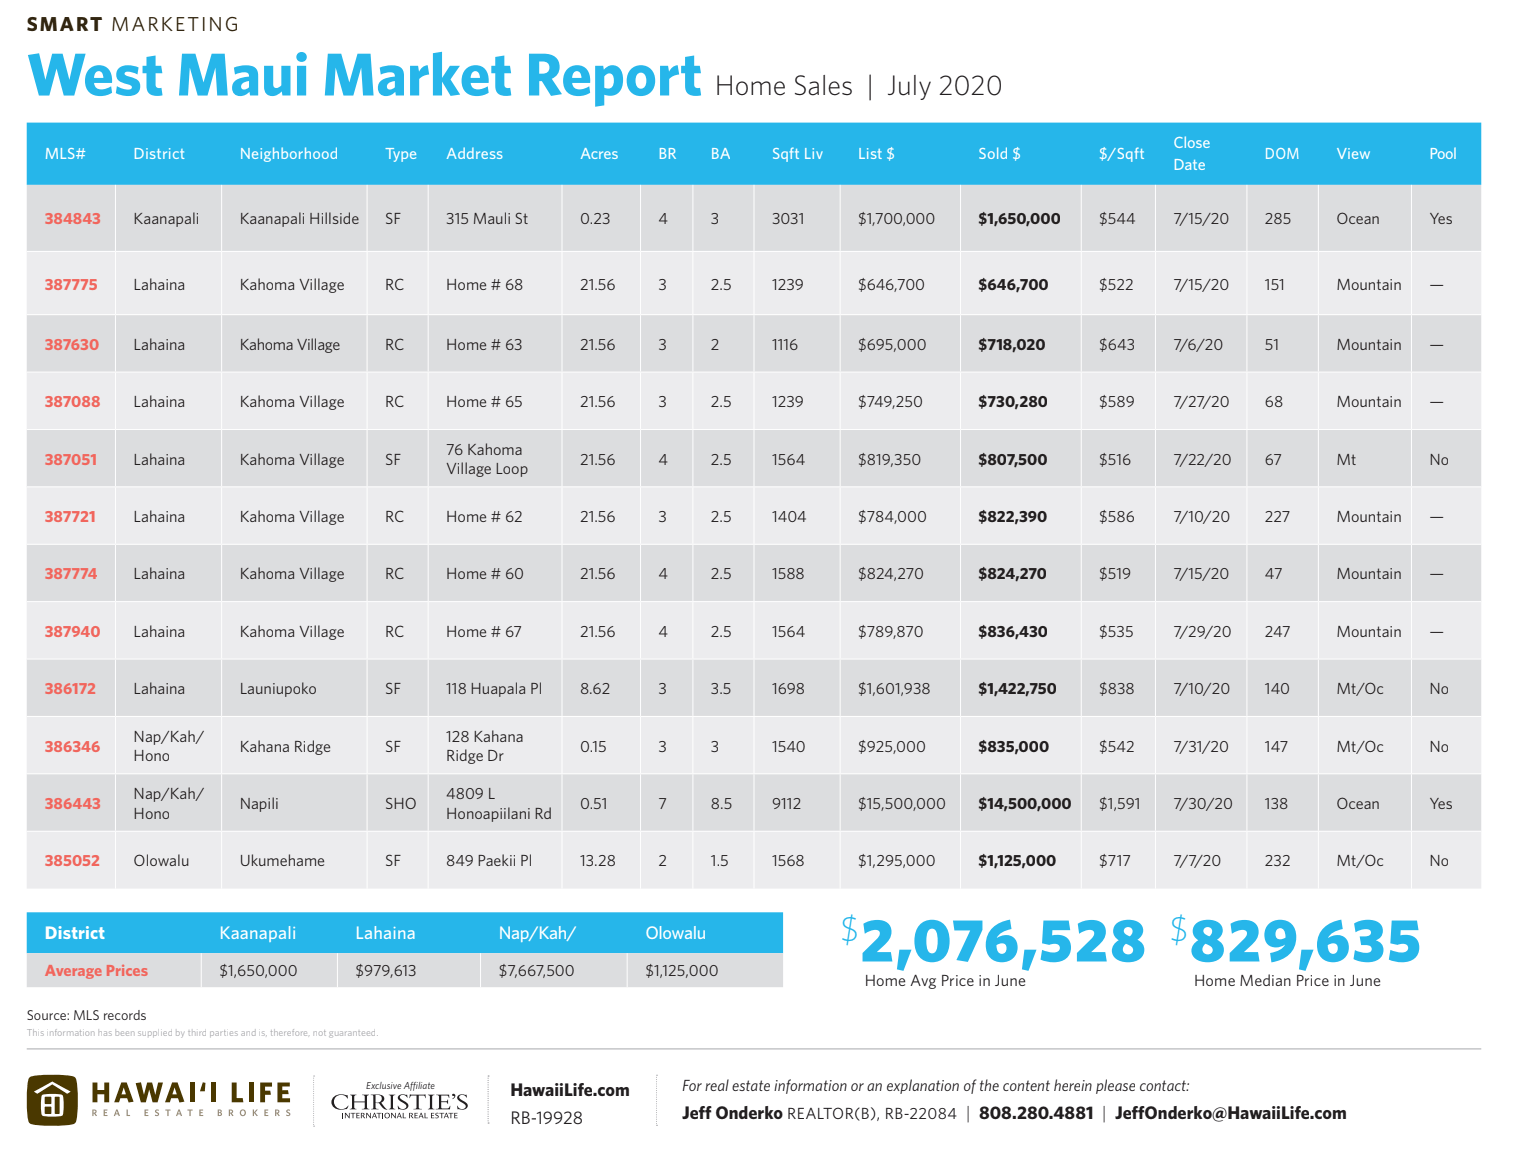
12 total home sales – 7 were previously sold new development sales (Kahoma Village).
-
The Uber Lux – a Napili oceanfront sold for $14.5M
-
Only 2 sales in Kapalua | Area down 60% in year over year transactions
-
This is the 2nd consecutive month with 0 land sales
- Homes & Condos – Average prices UP, Median prices DOWN
- Median Sales Prices:
- Homes: July $829,635K
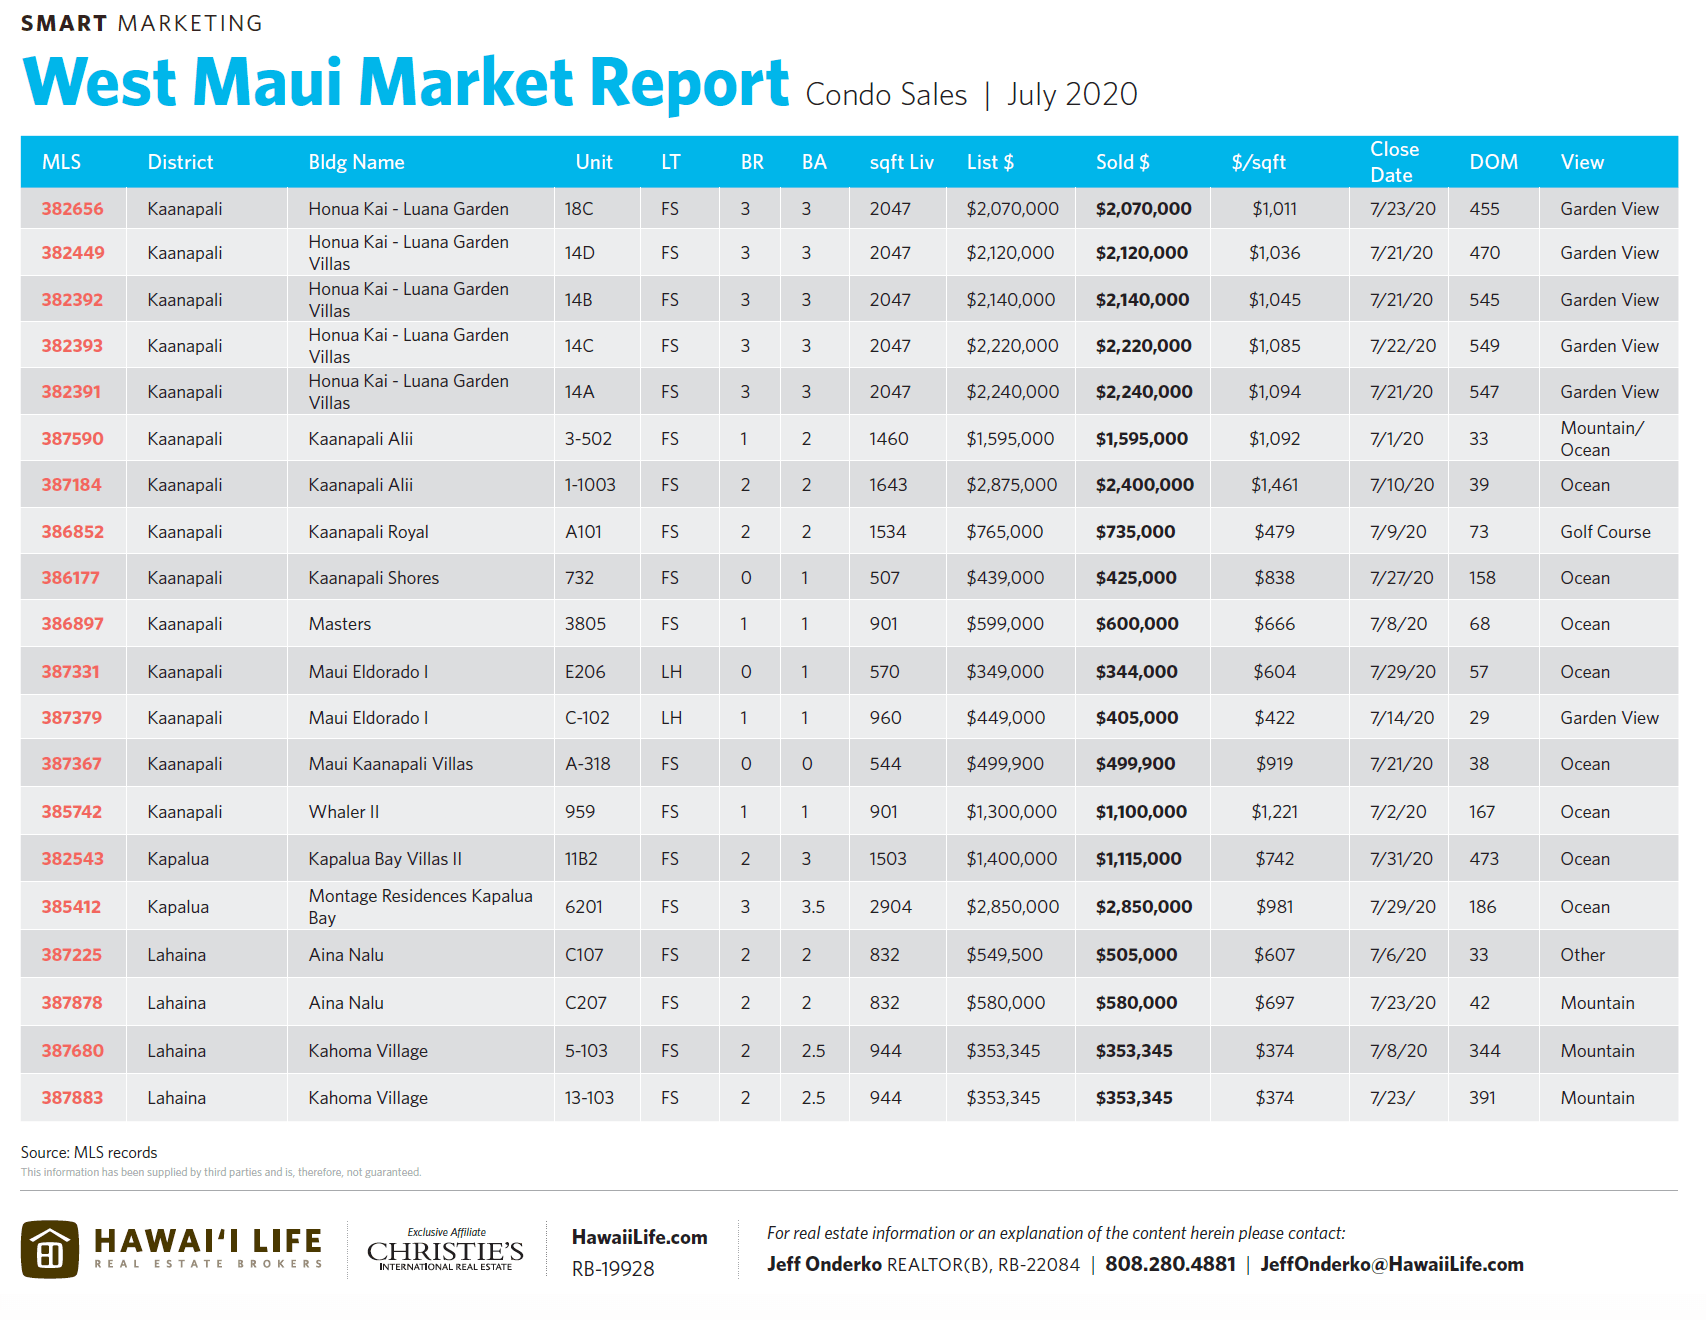
- Condos: July $585K
- Land: N/A
- Highest Priced Sales:
- Home – $14.5M in Napili neighborhood
- Condominium – $2.85M at Montage Residences Kapalua Bay
- Lowest Priced Sales:
- Home – $646K in Lahaina’s Kahoma Village neighborhood
- Condo – $125K at the West Maui Trades in Nap/Kah/Hono neighborhood
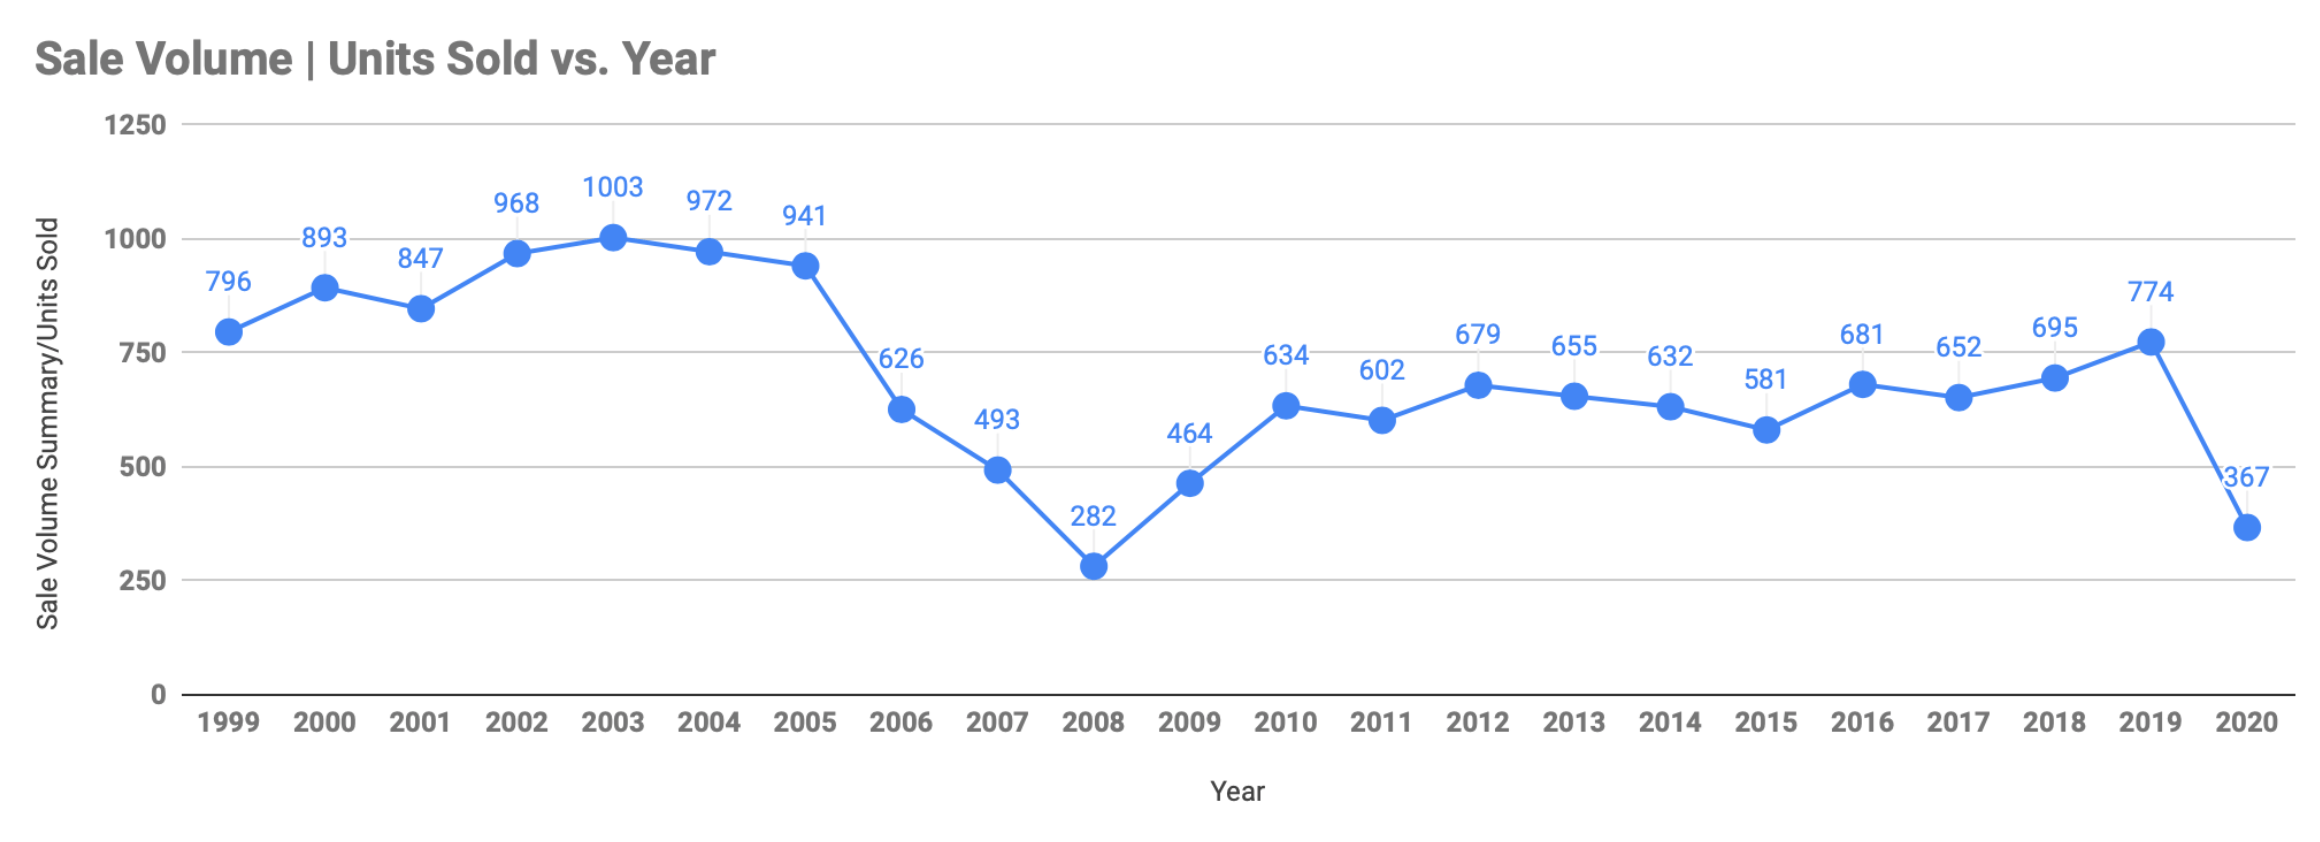
Historical Median & Average Price Comparison
| Year | Median Sold Price | Median Price % Yr Gr | Avg Sold Price | Avg Price % Yr Gr | DOM | # Sold |
| 2020 | $1,112,500 | -10.1% | $1,852,497 | 7.2% | 157 | 76 |
| 2019 | $1,236,922 | 2.4% | $1,727,294 | -3.2% | 173 | 137 |
| 2018 | $1,207,500 | 9.8% | $1,785,099 | 15.4% | 188 | 130 |
| 2017 | $1,100,000 | 4.8% | $1,546,633 | -3.0% | 185 | 139 |
| 2016 | $1,050,077 | 5.0% | $1,595,145 | 14.0% | 194 | 147 |
| Year | Median Sold Price | Median Price % Yr Gr | Avg Sold Price | Avg Price % Yr Gr | DOM | # Sold |
| 2020 | $646,500 | 11.6% | $891,933 | 5.9% | 204 | 284 |
| 2019 | $579,500 | 1.7% | $841,913 | 1.0% | 182 | 614 |
| 2018 | $570,000 | 4.2% | $833,812 | 2.8% | 157 | 549 |
| 2017 | $547,000 | 8.0% | $811,436 | 9.0% | 164 | 482 |
| 2016 | $506,250 | -0.7% | $744,555 | -3.9% | 211 | 490 |
| Year | Median Sold Price | Median Price % Yr Gr | Avg Sold Price | Avg Price % Yr Gr | DOM | # Sold |
| 2020 | $601,788 | -19.8% | $730,808 | -26.2% | 125 | 10 |
| 2019 | $750,000 | -7.7% | $990,609 | 1.1% | 256 | 23 |
| 2018 | $812,375 | -1.5% | $979,829 | 18.1% | 526 | 22 |
| 2017 | $825,000 | -2.9% | $829,477 | -5.0% | 293 | 33 |
| 2016 | $850,000 | 32.3% | $873,147 | 7.0% | 294 | 49 |
| 2015 | $642,500 | -6.9% | $815,858 | -22.7% | 498 | 30 |
Want to Know More?
If you are in the market for buying or selling West Maui real estate or have any questions about the area or the market in general, please feel free to contact me. I welcome the opportunity to give you information on my previous sales performance and marketing strategies. Or if you’re curious about what your property is worth in today’s market, it would be my pleasure to provide you with property information and a value assessment free of any sales pitch.
Related Articles
Maui Real Estate Post Co-Vid | New Contract Volume
Million Dollar Maui | High-End Real Estate Gaining Traction
West Maui Real Estate Hitting Wall | Lux Market Still Churning

Leave your opinion here. Please be nice. Your Email address will be kept private, this form is secure and we never spam you.