West Maui End of Summer | Homes & Land Moving Faster, Condos Slowing
As it is my commitment to keeping the local community informed, I am pleased to share with you the most recent West Maui home, land, and condo sales reports for your review — covering Kaanapali, Kapalua, Lahaina, and Launiupoko. You’ll find real estate sales volume, days on market, list versus sold price, price per square foot, and significantly more.
West Maui August 2020 Headlines
For further details on any of the statements below, please refer to the sales reports.
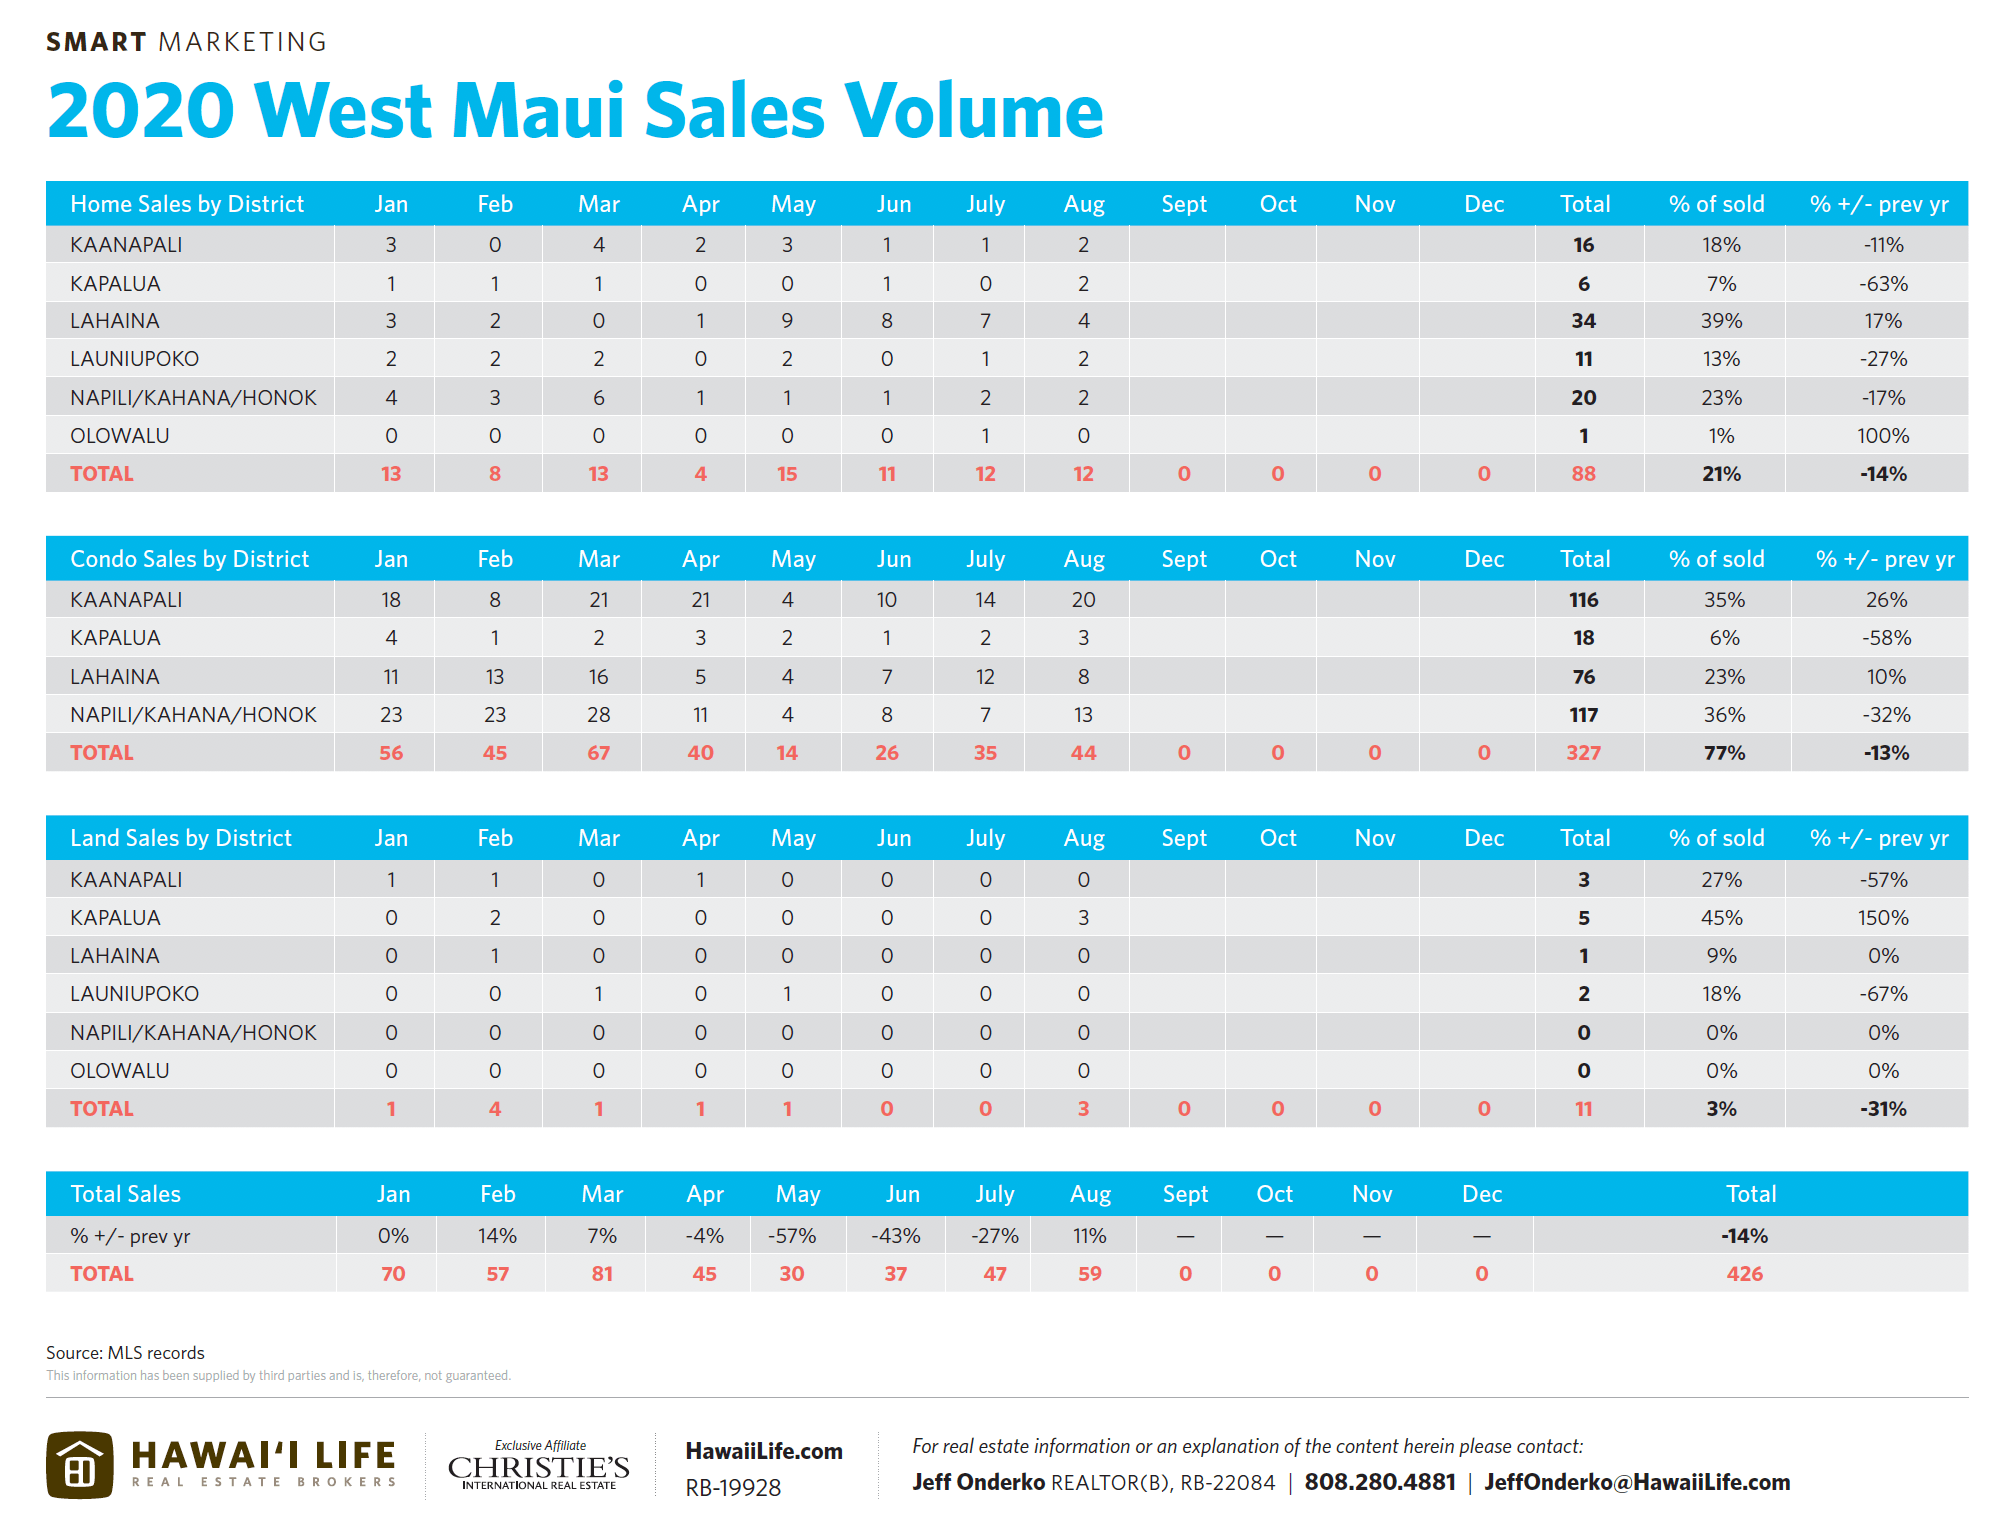
- 59 sales in July | Highest total since March (2019 avg was 65/ month)
- New development in demand as Kaanapali’s Luana Kai and Lahaina’s Kahoma Village are selling strong (30% of all West Maui home & condo sales)
- Overall WM sales volume is down a modest -14% from previous year considering the shit storm our island’s personal & business environment has faced on in 2020 | The $1M+ market is only down 5%.
- Residential Days on Market is down roughly 20 days compared to 2019 while condo DOM is up more than 25 days.
- Land is moving fast, nearly 70 days on market faster than last year.
- Median Home Prices are down 10% | Condos prices up 12% | Land +7%
- Median Sales Prices
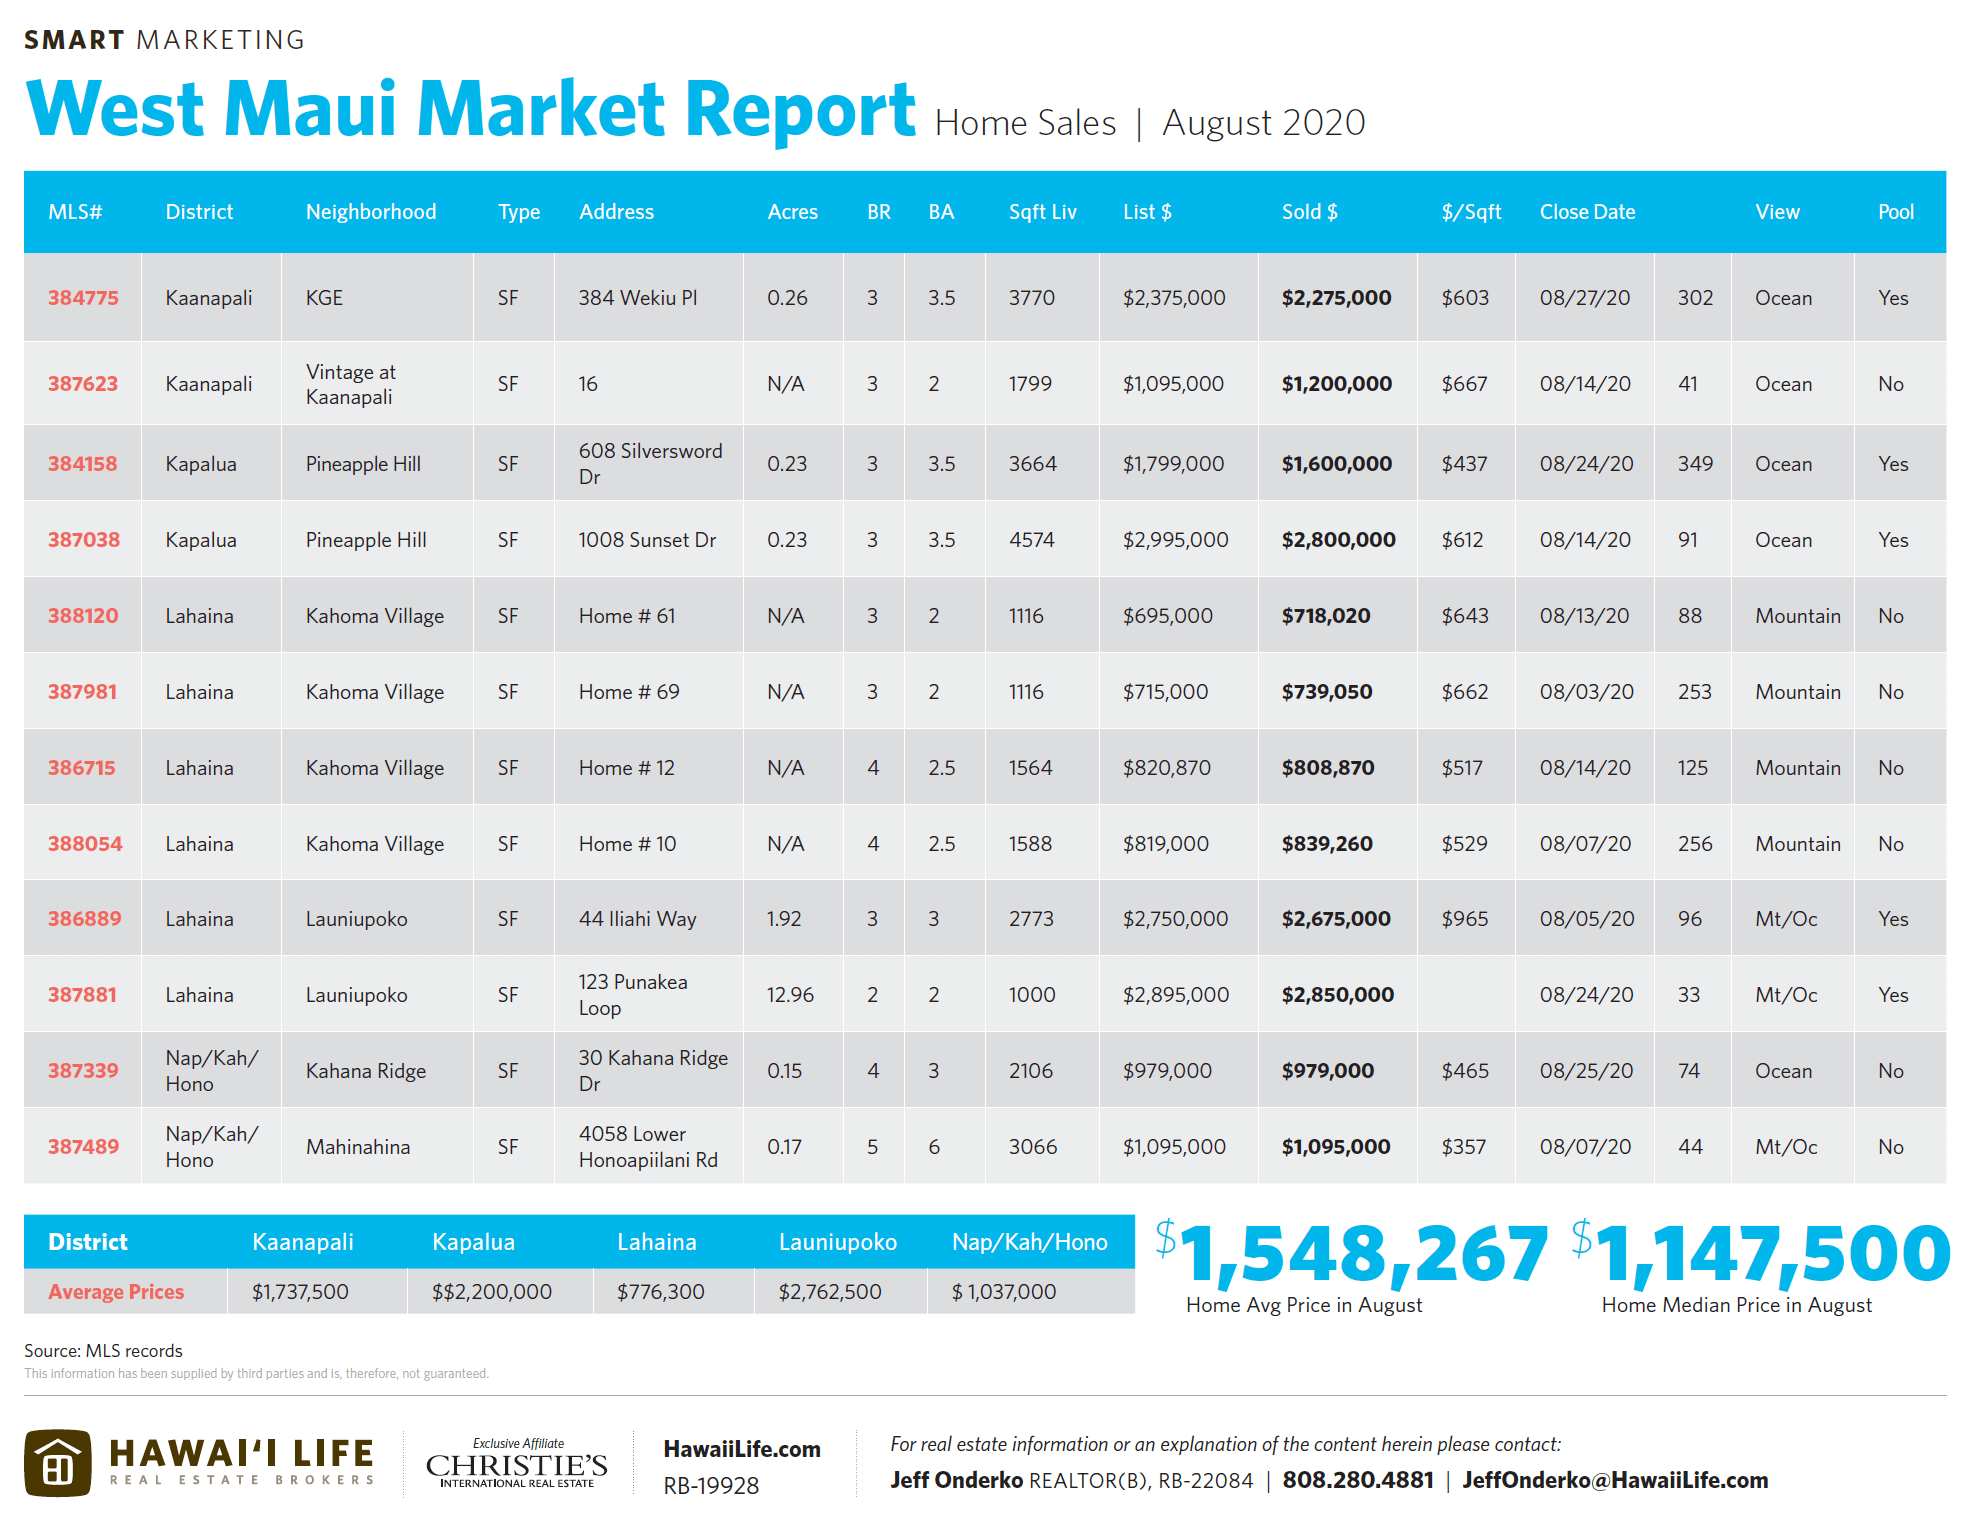
- Homes: August $1,147,500 July $829,635K
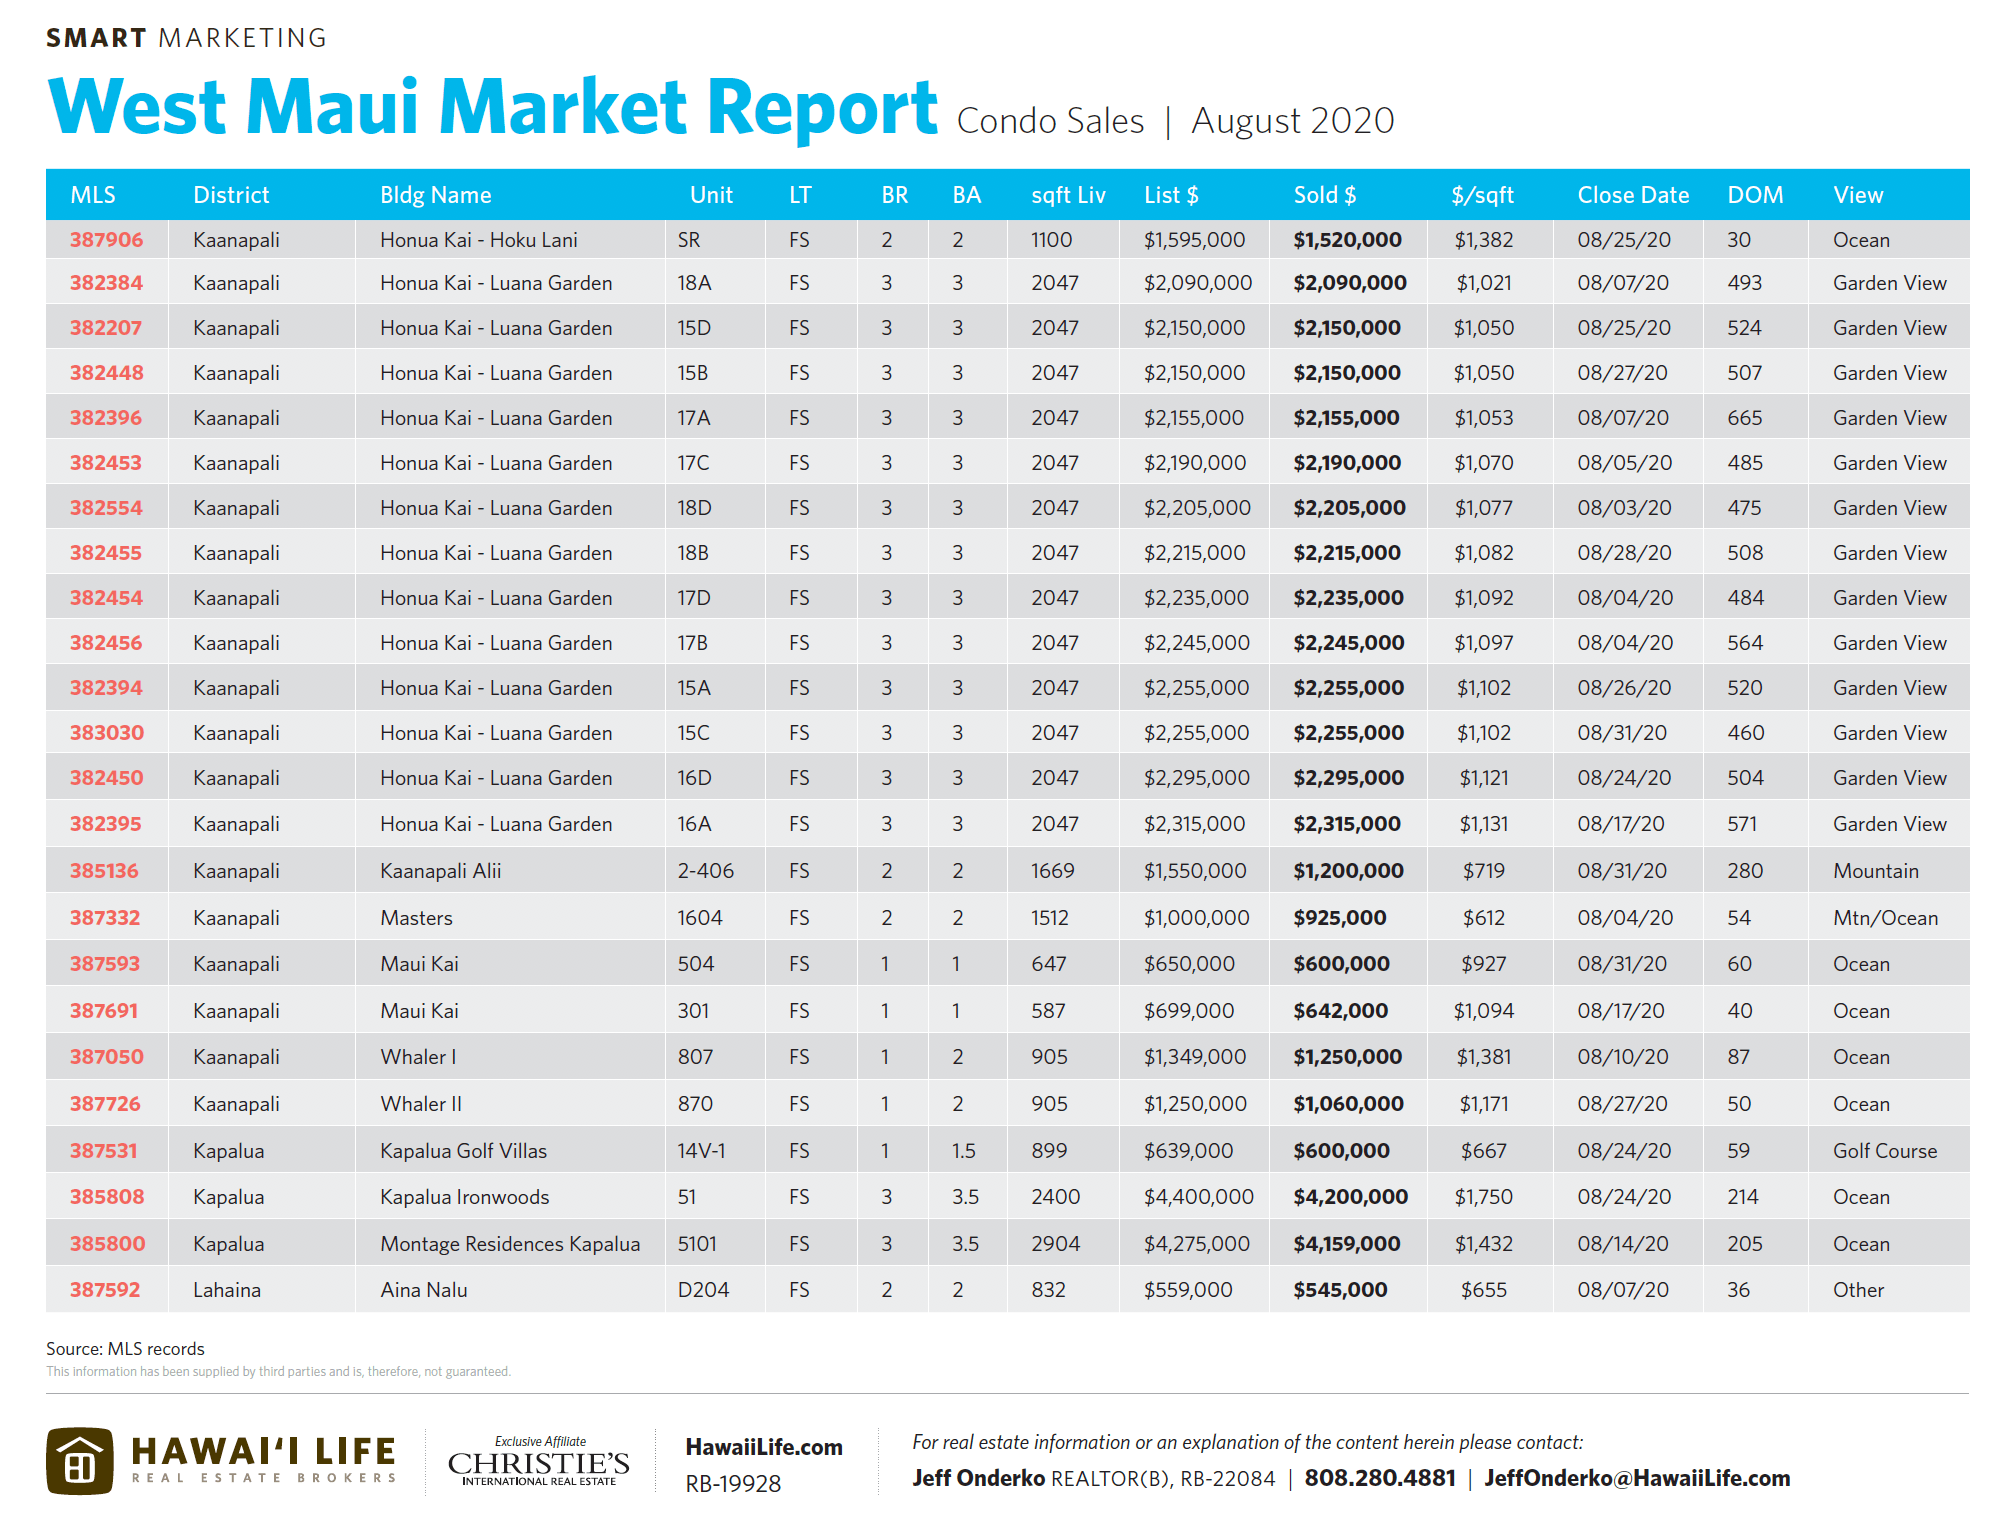
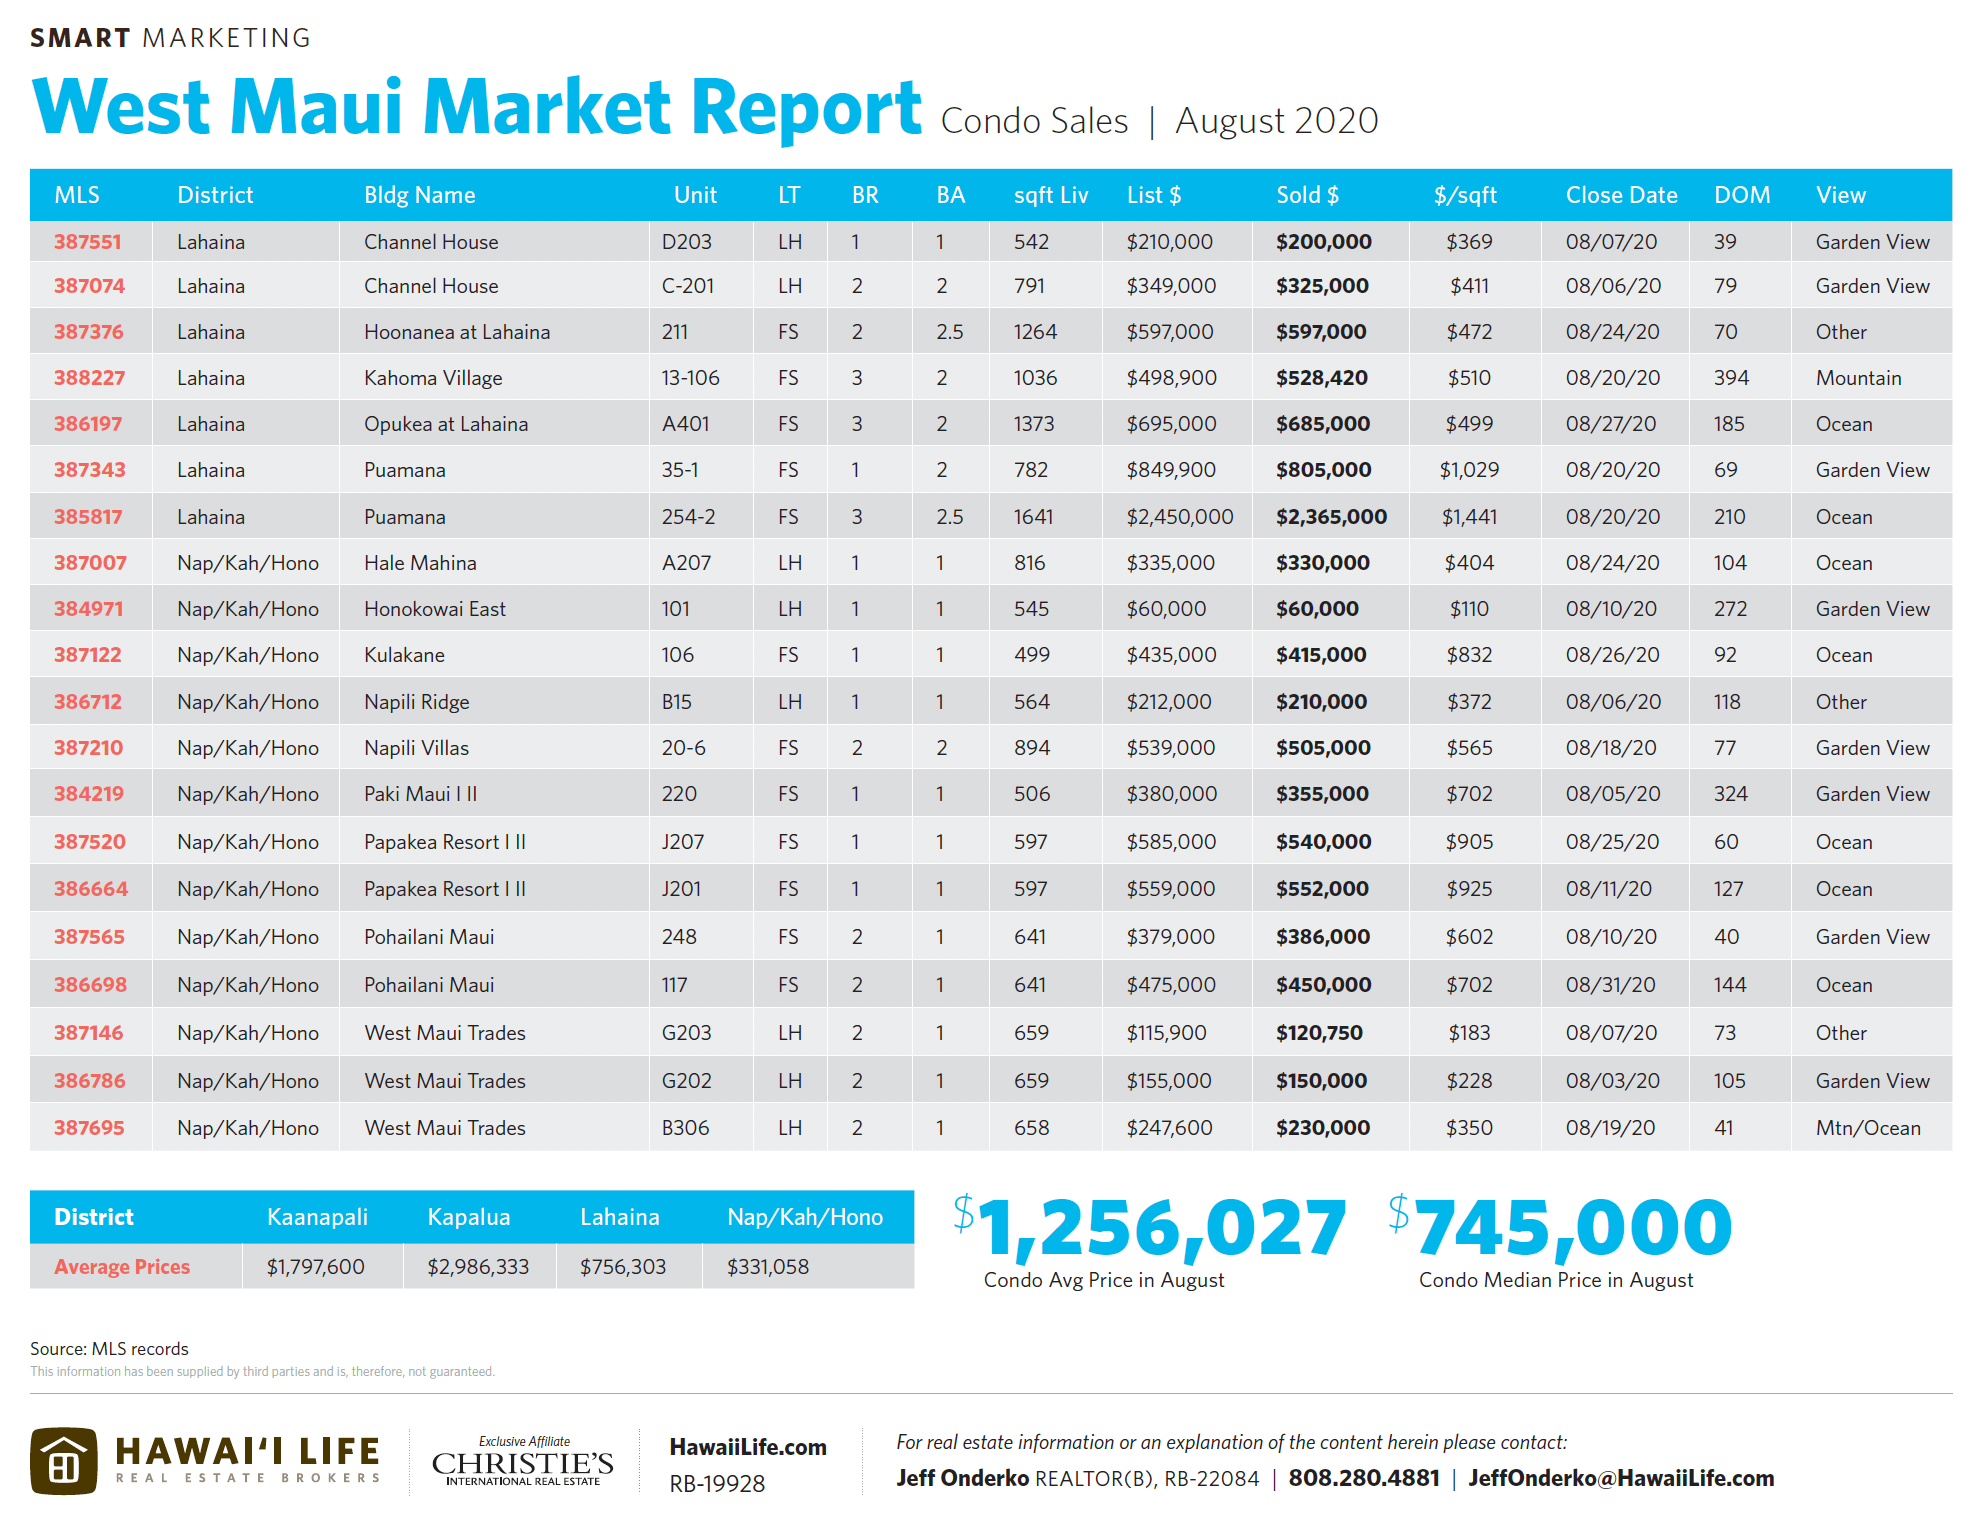
- Condos: August $745,000
- Land: $900,000
- Highest Priced Sales
- Home – $2.85M | Launiupoko
- Condo – $4.2M | Kapalua Ironwoods
- Land – $8M | Kapalua Place
- Lowest Priced Sales
- Home – $718K | Lahaina’s Kahoma Village
- Condo – $60K | Honokowai East in Nap/Kah/Hono neighborhood
- Land – $800K | Plantation Estates, 2.14 acres
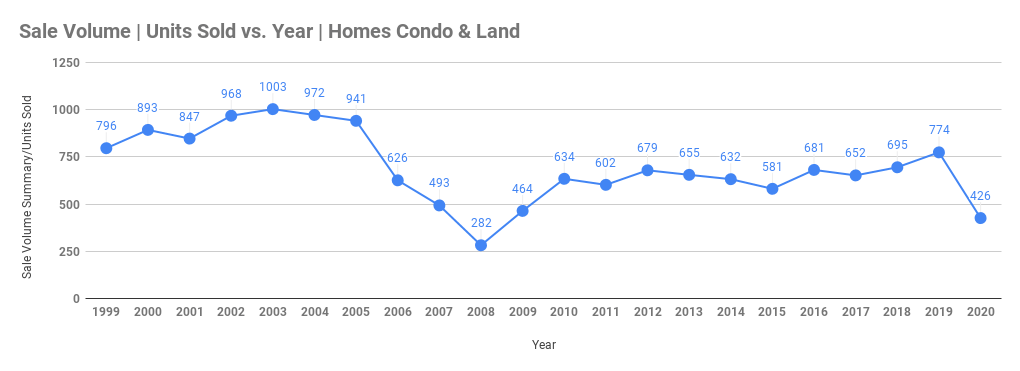
Historical Median & Average Price Comparison
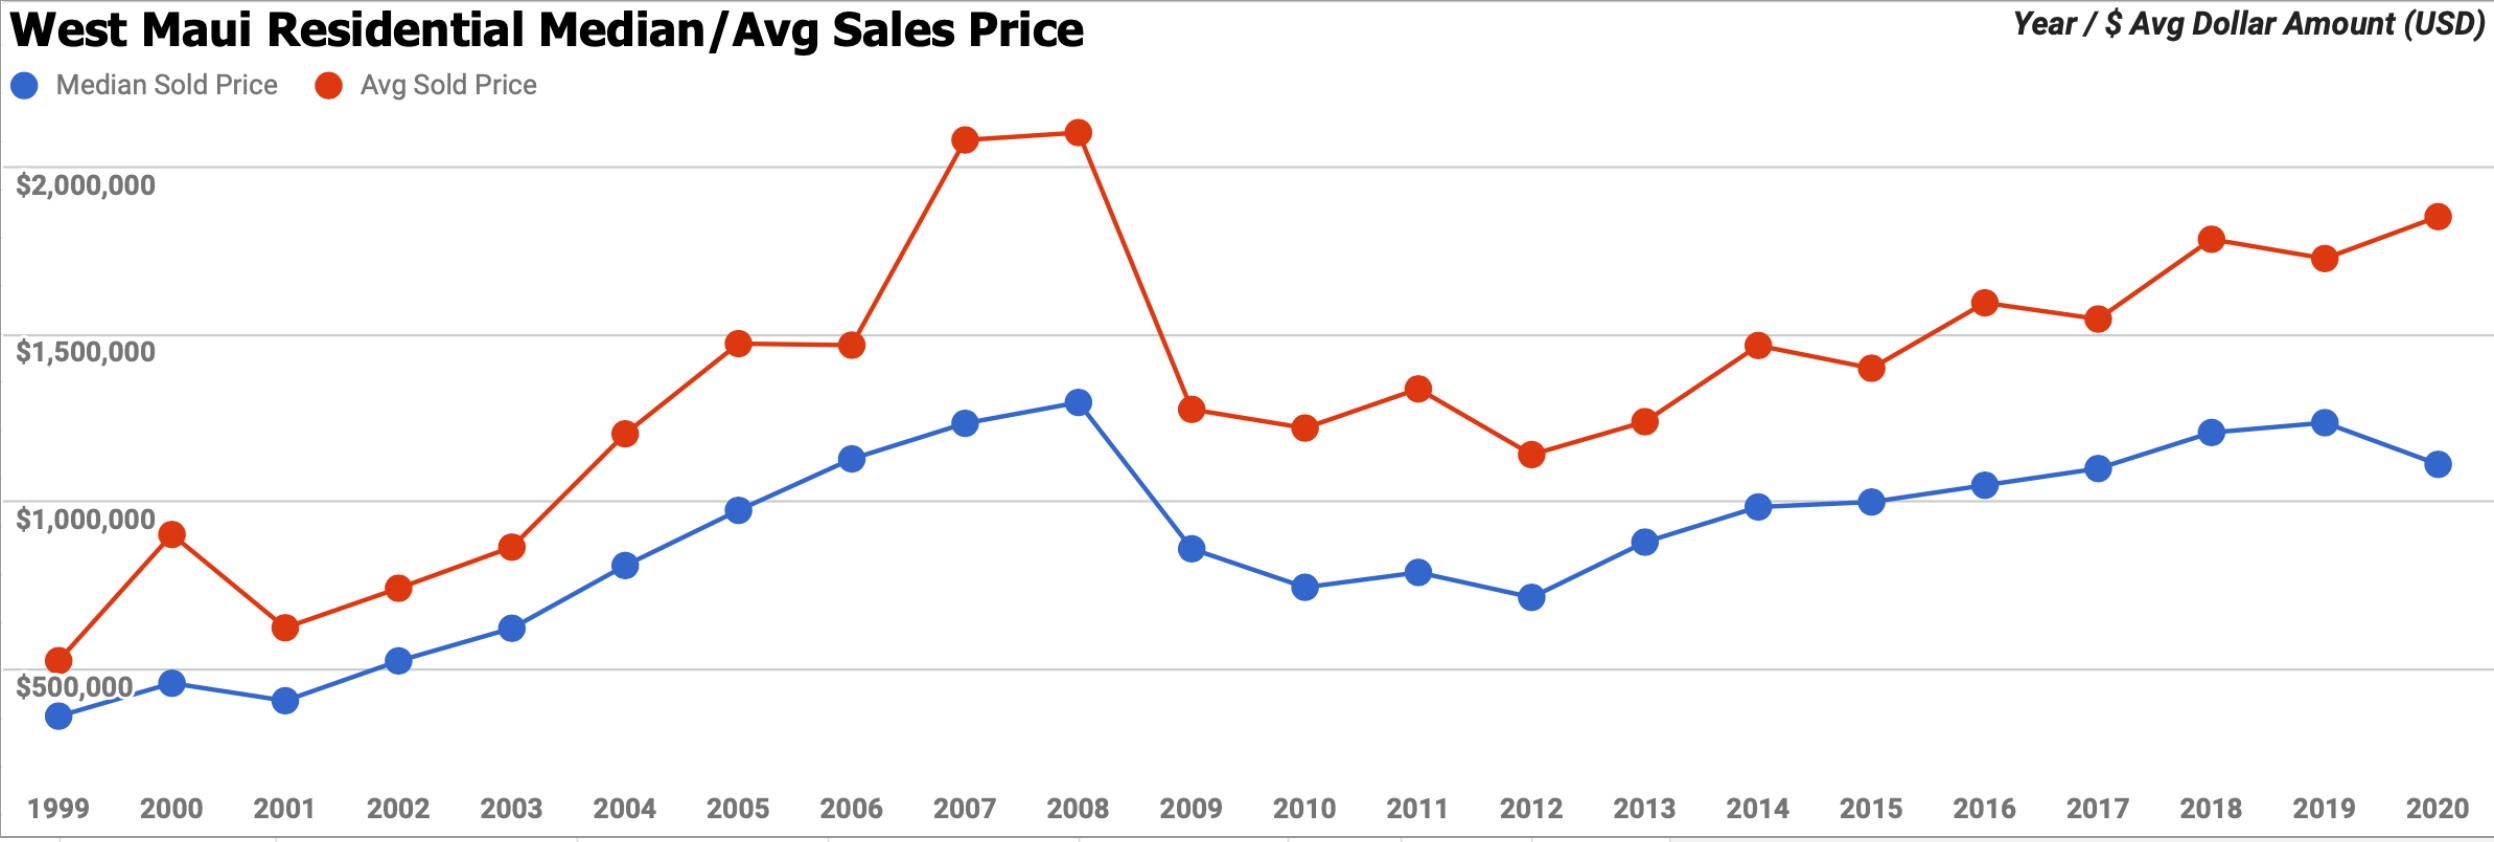
Year Median Sold Price Median Price % Yr Gr Avg Sold Price Avg Price % Yr Gr DOM # Sold 2020 $1,112,500 -10.1% $1,811,011 4.8% 155 88 2019 $1,236,922 2.4% $1,727,294 -3.2% 173 137 2018 $1,207,500 9.8% $1,785,099 15.4% 188 130 2017 $1,100,000 4.8% $1,546,633 -3.0% 185 139 2016 $1,050,077 5.0% $1,595,145 14.0% 194 147 Year Median Sold Price Median Price % Yr Gr Avg Sold Price Avg Price % Yr Gr DOM # Sold 2020 $649,000 12.0% $940,775 11.7% 208 328 2019 $579,500 1.7% $841,913 1.0% 182 614 2018 $570,000 4.2% $833,812 2.8% 157 549 2017 $547,000 8.0% $811,436 9.0% 164 482 2016 $506,250 -0.7% $744,555 -3.9% 211 490 Year Median Sold Price Median Price % Yr Gr Avg Sold Price Avg Price % Yr Gr DOM # Sold 2020 $800,000 6.7% $1,308,313 32.1% 182 13 2019 $750,000 -7.7% $990,609 1.1% 256 23 2018 $812,375 -1.5% $979,829 18.1% 526 22 2017 $825,000 -2.9% $829,477 -5.0% 293 33 2016 $850,000 32.3% $873,147 7.0% 294 49 Want to Know More?
If you are in the market for buying or selling West Maui real estate or have any questions about the area or the market in general, please feel free to contact me. I welcome the opportunity to give you information on my previous sales performance and marketing strategies. Or if you’re curious about what your property is worth in today’s market, it would be my pleasure to provide you with property information and a value assessment free of any sales pitch.
Related Articles
Maui Real Estate Post Co-Vid | New Contract Volume
Million Dollar Maui | High-End Real Estate Gaining Traction
West Maui Real Estate Hitting Wall | Lux Market Still Churning

Leave your opinion here. Please be nice. Your Email address will be kept private, this form is secure and we never spam you.