As part of my commitment to keeping the community informed about West Maui’s dynamic, micro-market real estate environment, I’m bringing you an up-to-date, comprehensive property market summary of Puamana, Lahaina’s premier oceanfront gated community.

What You’ll Find
- Actual Sales Prices: learn exactly how much specific properties sold for
- Sales Volume: see the strength of the market in terms of how many properties sold
- Days on Market: understand how long it takes the average property to sell
- List Price vs. Sold Price: see how the final sales price compares to the listing price
- Price Per Square Foot: which is critical in calculating real estate values
- Asset % Growth: what is the year over year appreciation of my property
- Current Inventory: what is actively for sale and currently under contract
Before we dig into the numbers, make sure you subscribe to my newsletter if you want to be notified of future market reports as they come available.
Sales Sales & More Sales Data
While 2019 sales prices may look down, it’s necessarily not the case as Puamana had multiple large oceanfront sales in 2018.
History says with peak pricing, sales volume generally decreases
Puamana Historical Sales Summary
| YEAR | Avg List Price | Avg Sale Price | % of List Price | % Yr Gr | Pr/Liv Sq ft | Avg – DOM | # Sold | % Yr Gr |
| 2019 | $969,333 | $929,333 | 96% | -41% | $1,087 | 146 | 3 | -77% |
| 2018 | $1,614,038 | $1,565,000 | 97% | 49% | $1,207 | 110 | 13 | 18% |
| 2017 | $1,093,364 | $1,052,545 | 96% | 19% | $862 | 134 | 11 | 38% |
| 2016 | $911,463 | $881,650 | 97% | -22% | $1,009 | 102 | 8 | -27% |
| 2015 | $1,230,864 | $1,125,400 | 91% | 20% | $914 | 164 | 11 | -15% |
| 2014 | $1,011,608 | $936,231 | 93% | 2% | $1,013 | 232 | 13 | 30% |
| YEAR | Avg List Price | Avg Sale Price | % of List Price | % Yr Gr | Pr/Liv Sq ft | Avg – DOM | # Sold | % Yr Gr |
| 2019 | $856,500 | $846,500 | 99% | -11.0% | $1,198 | 177 | 2 | -50% |
| 2018 | $981,125 | $951,250 | 97% | 5.7% | $1,088 | 102 | 4 | 300% |
| 2017 | $825,000 | $900,000 | 109% | 19.8% | $1,402 | 338 | 1 | -75% |
| 2016 | $772,375 | $751,250 | 97% | 21.7% | $1,049 | 92 | 4 | 0% |
| 2015 | $611,875 | $617,500 | 101% | -51.0% | $703 | 97 | 4 | 100% |
| 2014 | $1,360,000 | $1,260,000 | 93% | 111.3% | $1,938 | 56 | 2 | 0% |
| YEAR | Avg List Price | Avg Sale Price | % of List Price | % Yr Gr | Pr/Liv Sq ft | Avg – DOM | # Sold | % Yr Gr |
| 2019 | $1,195,000 | $1,095,000 | 92% | -6.0% | $865 | 84 | 1 | -50% |
| 2018 | $1,240,000 | $1,165,000 | 94% | 22.6% | $1,007 | 174 | 2 | -71% |
| 2017 | $1,021,714 | $950,429 | 93% | -6.1% | $825 | 126 | 7 | 75% |
| 2016 | $1,050,550 | $1,012,050 | 96% | 32.8% | $1,049 | 112 | 4 | 100% |
| 2015 | $814,000 | $762,000 | 94% | 21.0% | $455 | 362 | 2 | -71% |
| 2014 | $665,238 | $629,500 | 95% | -5.7% | $553 | 254 | 7 | 40% |
| YEAR | Avg List Price | Avg Sale Price | % of List Price | % Yr Gr | Pr/Liv Sq ft | Avg – DOM | # Sold | % Yr Gr |
| 2019 | 0 | |||||||
| 2018 | $2,163,167 | $2,105,000 | 97% | 57% | $1,384 | 85 | 6 | 100% |
| 2017 | $1,350,000 | $1,341,667 | 99% | -21% | $950 | 85 | 3 | -40% |
| 2016 | 0 | |||||||
| 2015 | $1,892,800 | $1,705,000 | 90% | -32% | $1,178 | 139 | 5 | 67% |
| 2014 | $2,700,000 | $2,500,000 | 93% | 62% | $1,733 | 833 | 3 | 0% |
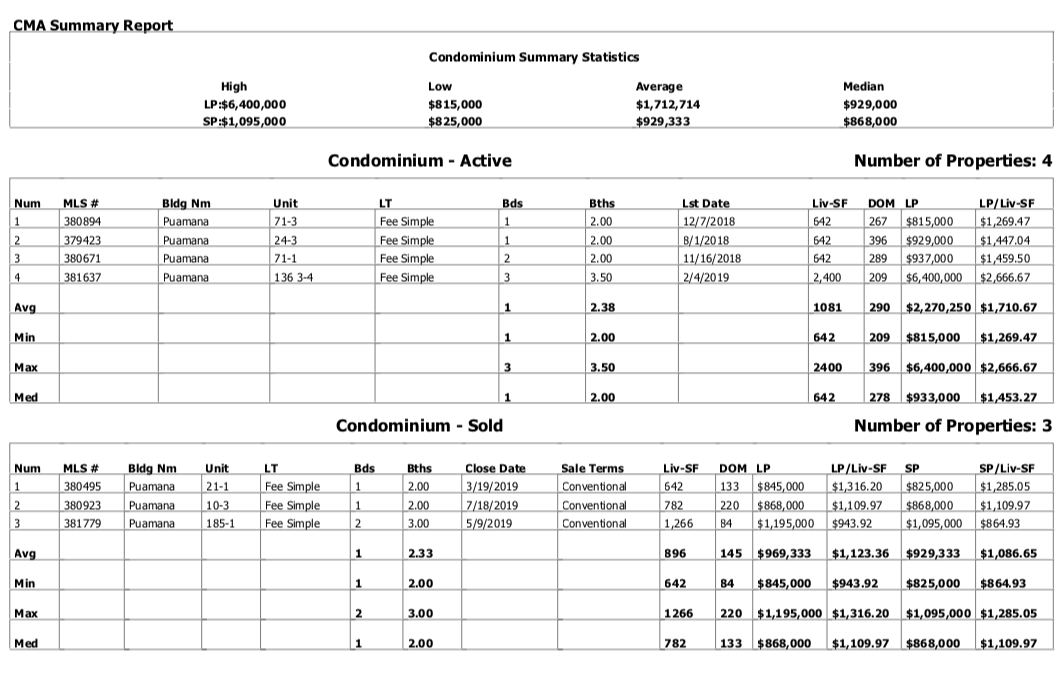
The Current Puamana Market
Want to Know More?
If you are in the market for buying or selling Puamana real estate or have any questions about the area or the market in general, please feel free to contact me. I welcome the opportunity to give you information on my previous sales performance and marketing strategies. Or if you’re curious about what your property is worth in today’s market, it would be my pleasure to provide you with property information and a value assessment free of any sales pitch.

Leave your opinion here. Please be nice. Your Email address will be kept private, this form is secure and we never spam you.