Opportunity & Lower Prices Driving Sales at Lahaina’s Aina Nalu
As part of my commitment to keeping the community informed about West Maui’s dynamic, micro-market real estate environment, I’m bringing you an up-to-date, comprehensive property market summary of Aina Nalu, Downtown Lahaina’s premier vacation resort community.
What You’ll Find
- Actual Sales Prices: learn exactly how much specific properties sold for
- Sales Volume: see the strength of the market in terms of how many properties sold
- Days on Market: understand how long it takes the average property to sell
- List Price vs. Sold Price: see how the final sales price compares to the listing price
- Price Per Square Foot: which is critical in calculating real estate values
- Asset % Growth: what is the year over year appreciation of my property
- Current Inventory: what is actively for sale and currently under contract
Before we dig into the numbers, make sure you subscribe to my newsletter if you want to be notified of future market reports as they come available.

Aina Nalu 2020 | Market Headlines
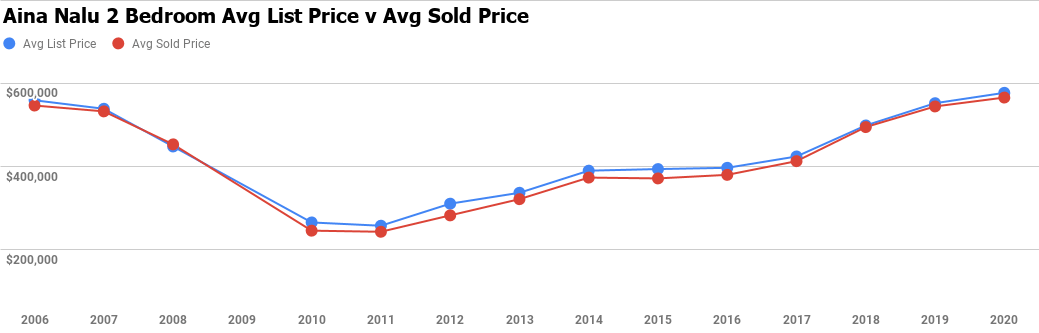
- At Aina Nalu, 2 bedroom units comprise 90% of the inventory. If the 2 bedroom model is the best indicator of the overall market conditions then things look a bit uncertain, and it’s showing.
- On the surface, conditions look good from a sales volume standpoint, however a bit unsettled from a valuation assessment.
- For perspective, after 4 months of literally no sales — we have seen a jolt of recent mid/end of summer activity, albeit significantly lower prices.
- To compare: 2 Bedroom – Sales Differences
- Avg Price of 6 sales Pre Covid Conditions $580,500
- Avg Price of 4 sales Covid Conditions $543,750
- Avg List Price of 4 units under contract $518,000
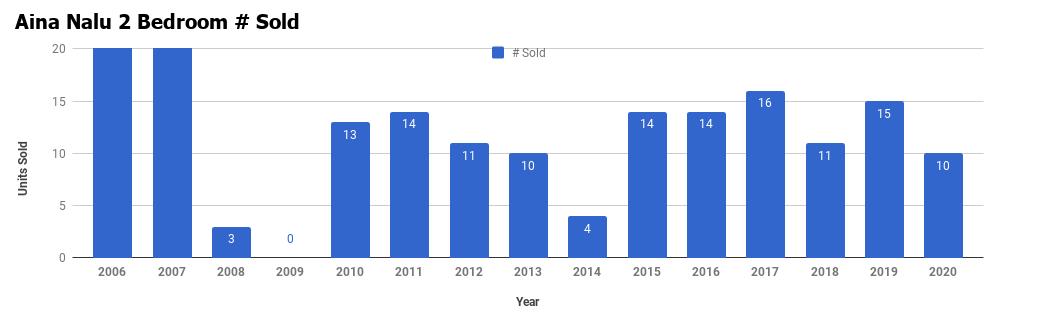
- Despite the recent price decrease, interest and demand remain strong as we will get close to the last year’s sales volume mark of 15 for the year. And, it should be mentioned that Days on Market this year sits at nearly 30% fewer days on market than 2019.
- Currently, 4 units are under contract and 6 are actively for sale.
Aina Nalu Historical Sales Summary
| Year | Avg List Price | Avg Sold Price | Yr Gr | % to List | DOM | # Sold |
| 2020 | $577,150 | $565,800 | 4% | 98% | 52 | 10 |
| 2019 | $552,200 | $544,433 | 10% | 99% | 74 | 15 |
| 2018 | $498,745 | $494,864 | 20% | 99% | 64 | 11 |
| 2017 | $424,250 | $412,991 | 9% | 97% | 89 | 16 |
| 2016 | $397,000 | $380,071 | 2% | 96% | 104 | 14 |
| Year | Avg List Price | Avg Sold Price | Yr Gr | % to List | DOM | # Sold |
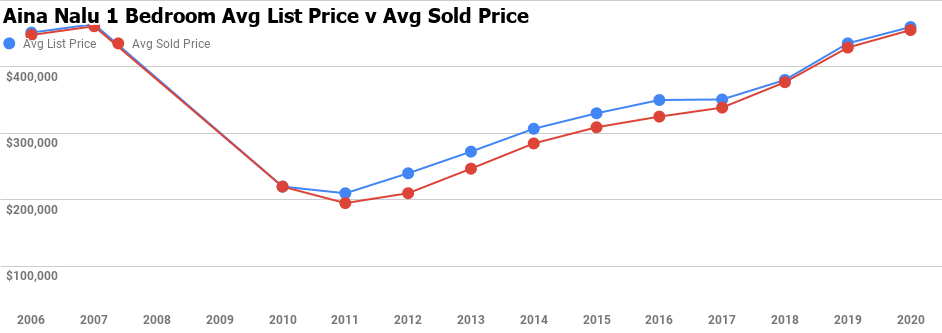
| 2020 | $459,500 | $455,000 | 6% | 99% | 56 | 1 |
| 2019 | $435,000 | $428,667 | 14% | 99% | 24.5 | 2 |
| 2018 | $380,000 | $376,667 | 11% | 99% | 47 | 3 |
| 2017 | $350,750 | $338,500 | 4% | 97% | 115 | 4 |
| 2016 | $349,900 | $325,000 | 5% | 93% | 43 | 1 |
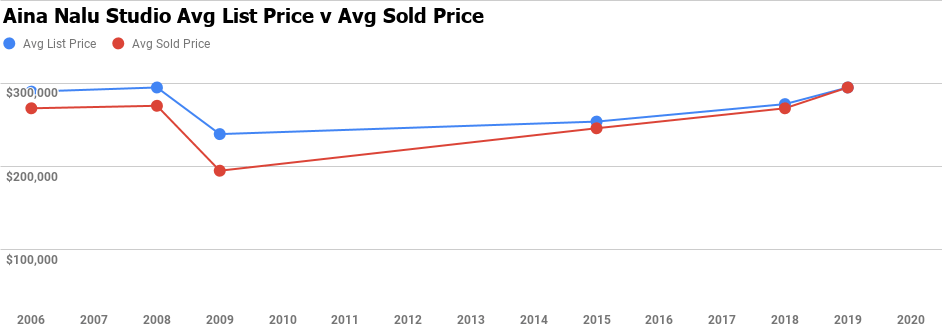
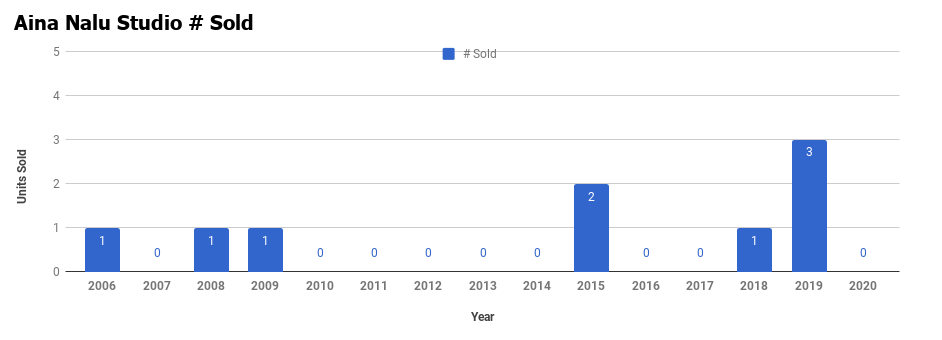
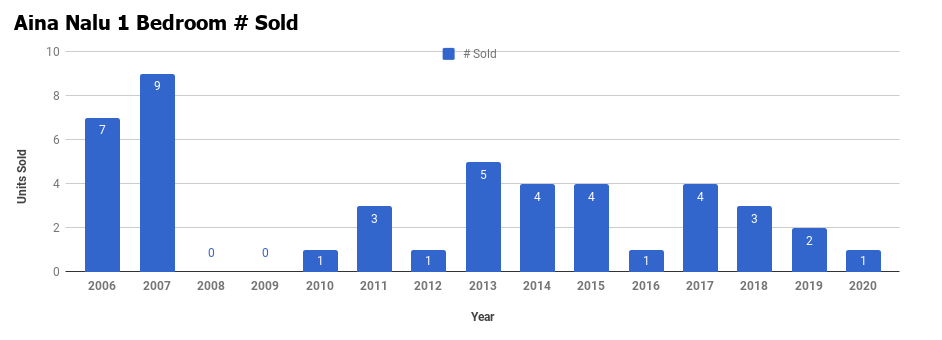
| Year | Avg List Price | Avg Sold Price | Yr Gr | % to List | DOM | # Sold |
| 2020 | 0 | |||||
| 2019 | $295,000 | $295,000 | 9% | 100% | 22 | 3 |
| 2018 | $275,000 | $270,000 | 10% | 98% | 25 | 1 |
| 2017 | 0 | |||||
| 2016 | 0 |
Want to Know More?
If you are in the market for buying or selling Aina Nalu real estate or have any questions about the area or the West Maui market in general, please feel free to contact me. I welcome the opportunity to give you information on my previous sales performance and marketing strategies. Or if you’re curious about what your property is worth in today’s market, it would be my pleasure to provide you with property information and a value assessment free of any sales pitch.

Leave your opinion here. Please be nice. Your Email address will be kept private, this form is secure and we never spam you.