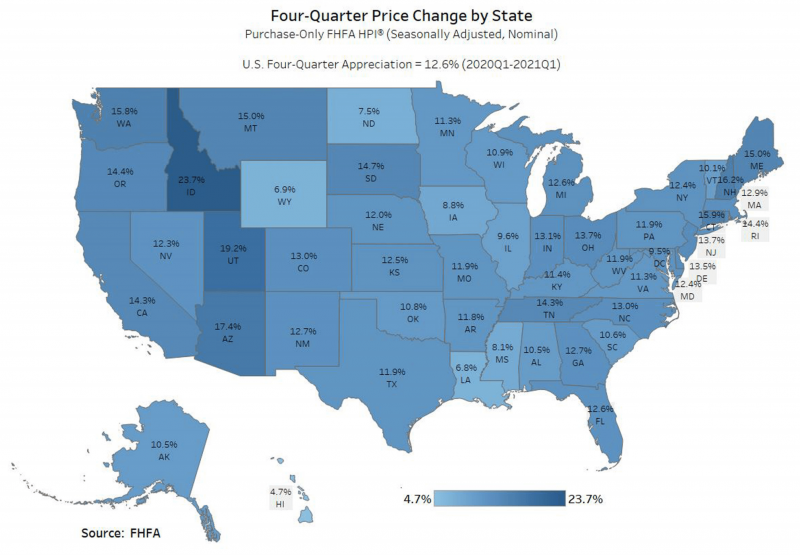
If we look at the big picture, median home price, nationally, is up 12.6%, in the 2nd quarter of 2021 (year over year). This is the 14th consecutive quarterly increase in median price and the highest quarterly gain in several decades. All 50 states, including the District of Columbia, had positive gains.
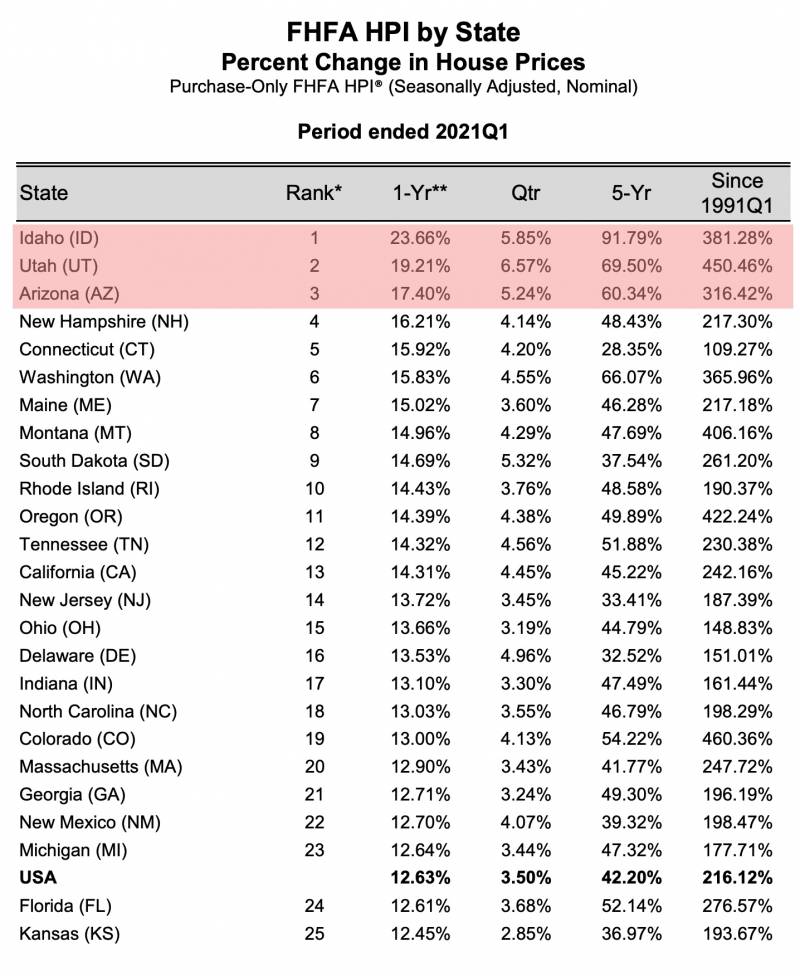
The top three gains, in the US, were experienced in the Mountain Region by Idaho, Utah & Arizona with about a 20% average gain.
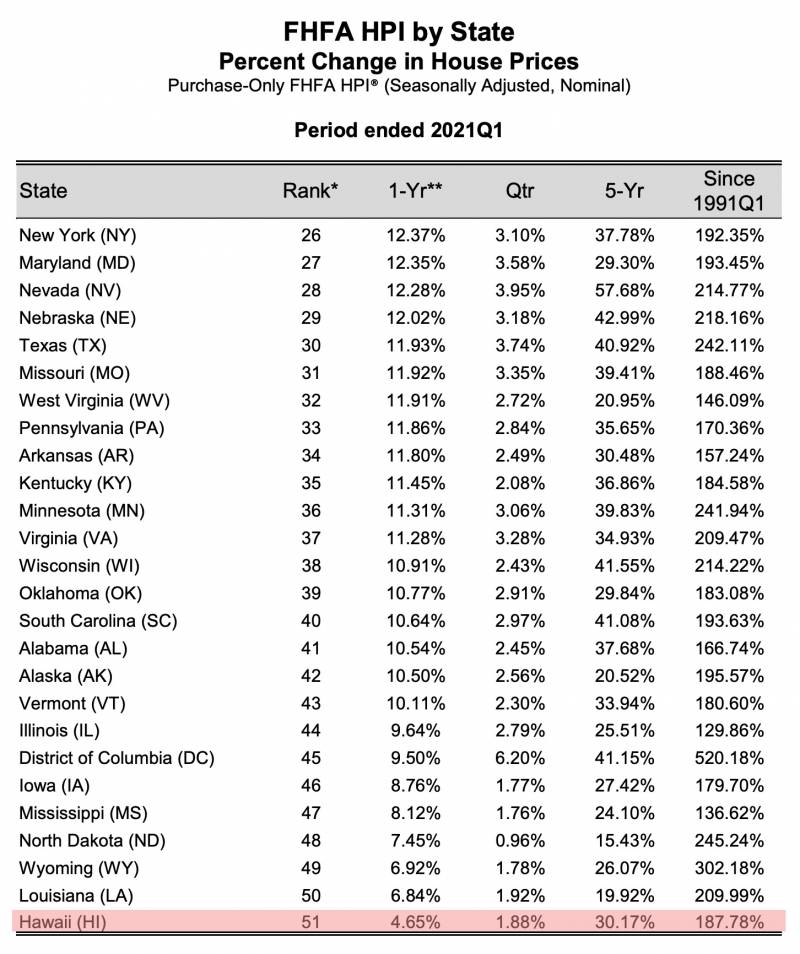
The state of Hawaii came in last, for price appreciation, with an increase of 4.65%, on average.
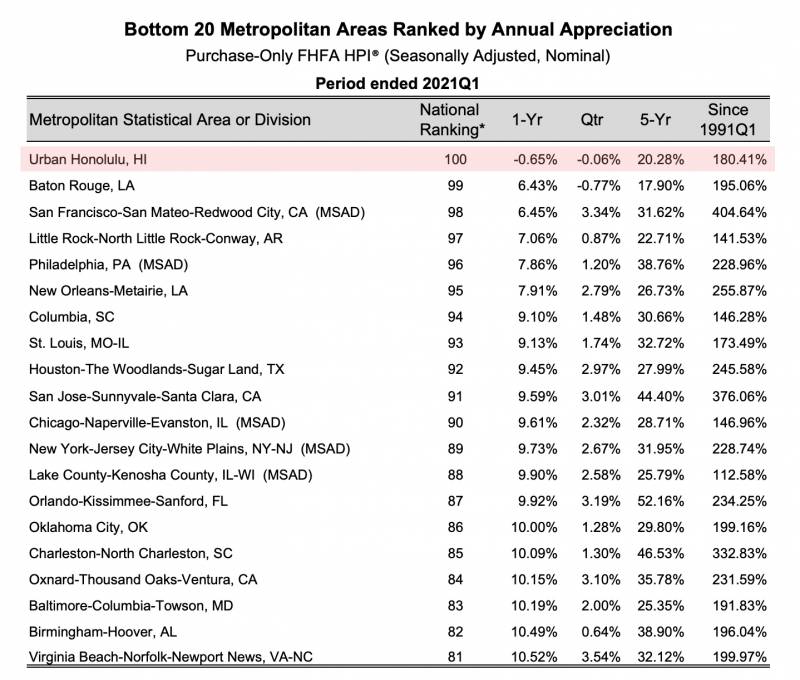
The City and County of Honolulu, on average, was down .65% and is 100th in the country for price appreciation. This low number is probably due to the large concentration of condos in the urban core of Honolulu and the “Donut Effect.”
Paul Brewbaker, local economist, says the “price jump was all in SF homes, not condos.”
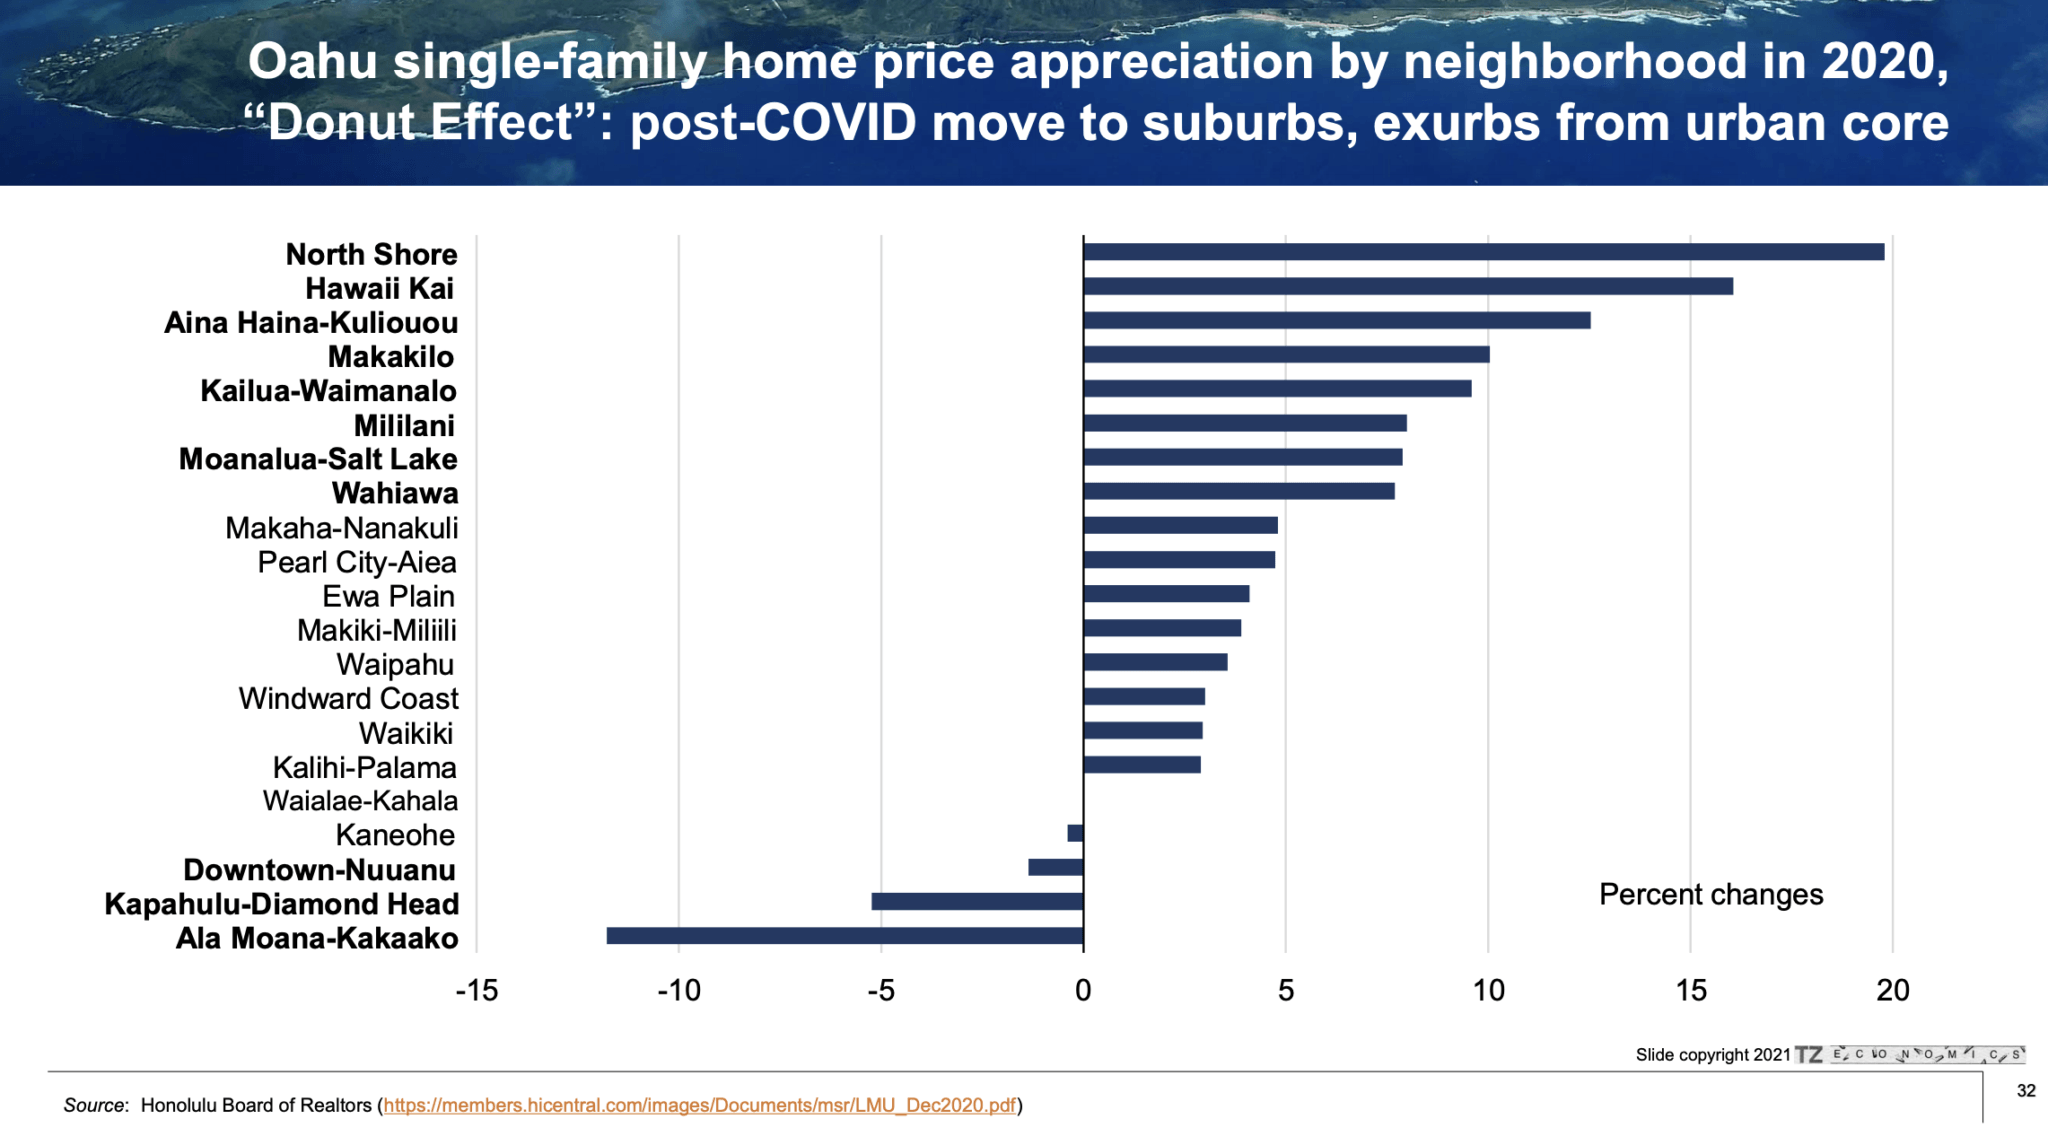
This chart demonstrates the “Donut Effect,” and how price appreciation was experienced most greatly in the neighborhoods outside of the urban core. For example, “the suburbs, exurbs and zoom towns”
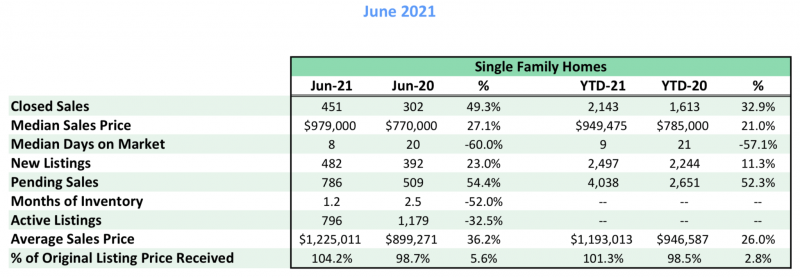
Hawaii Kai is an example of a “neighborhood outside of the urban core. Its numbers for June 202 are clearly demonstrate the “Donut Effect” occurring. We saw a 33% increase in closings, 57% decrease in days on market and a median price increase of 21%.

Hawaii’s Economic Activity Index has recovered from the lows of 78.31 points in May 2020, to 117.17. This 2nd quarter number is off just ~10% of Hawaii’s all-time high, peak of 129.56 in Feb, 2020.
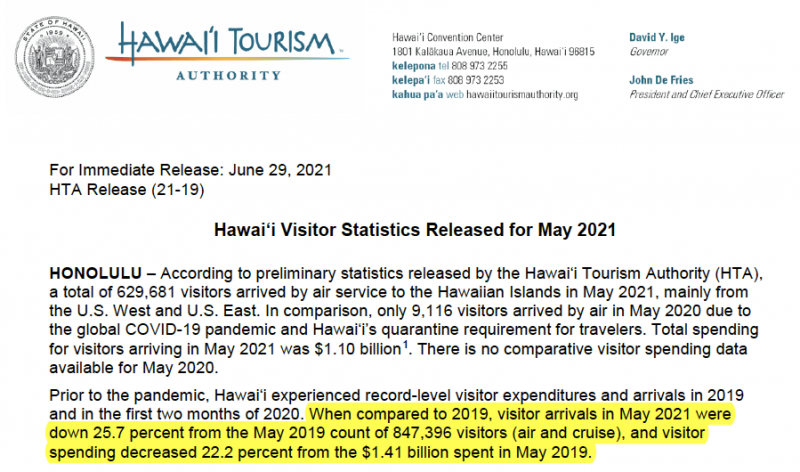
Arrivals and spending, in May 2020, were back within 26% and 22%, respectively, of the record-level state highs in May 2019.
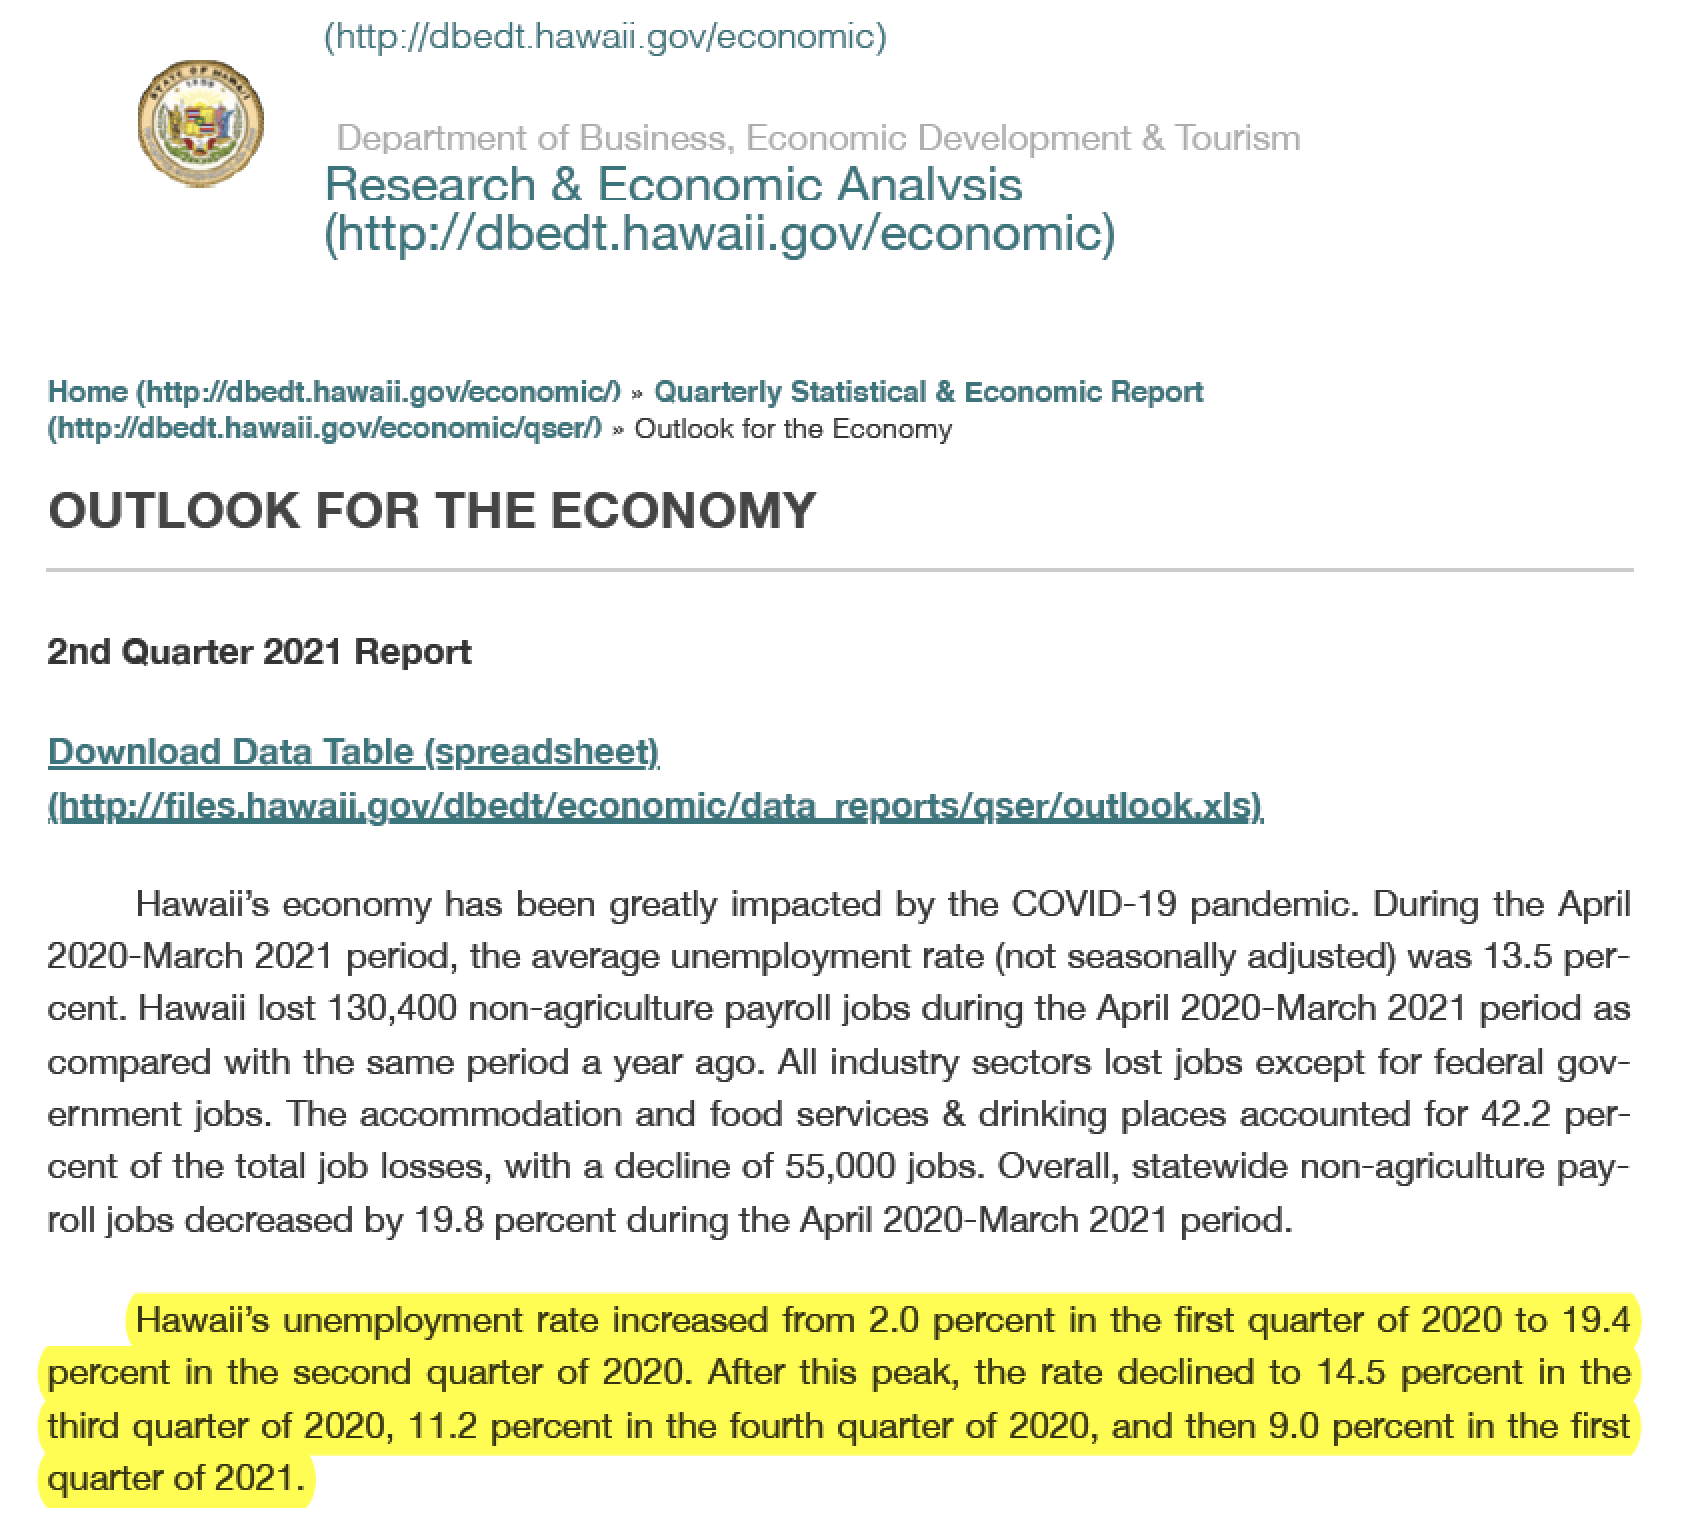
We can see unemployment numbers are consistently dropping from the highs of 19.4% in 2nd quarter, 2020 to 9% down in 1st quarter, 2021.
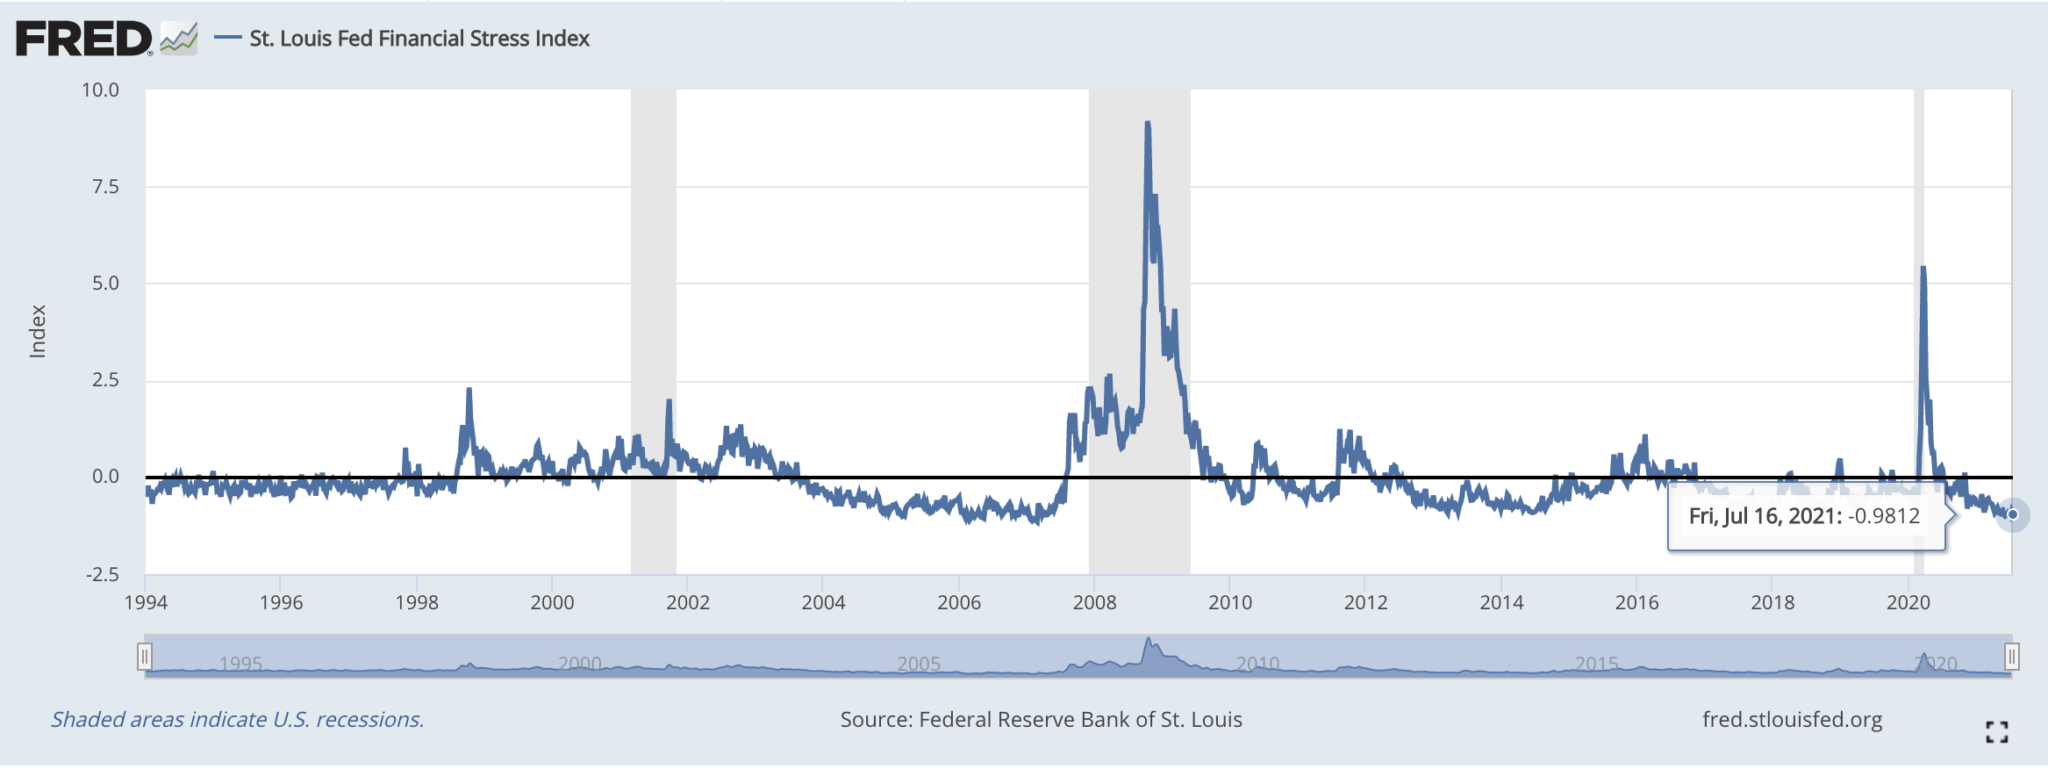
The financial stress index is at -.98 points, which is much better than the highs we saw at 5 points, back in March, 2020. And 9 points in 2008’s financial collapse.
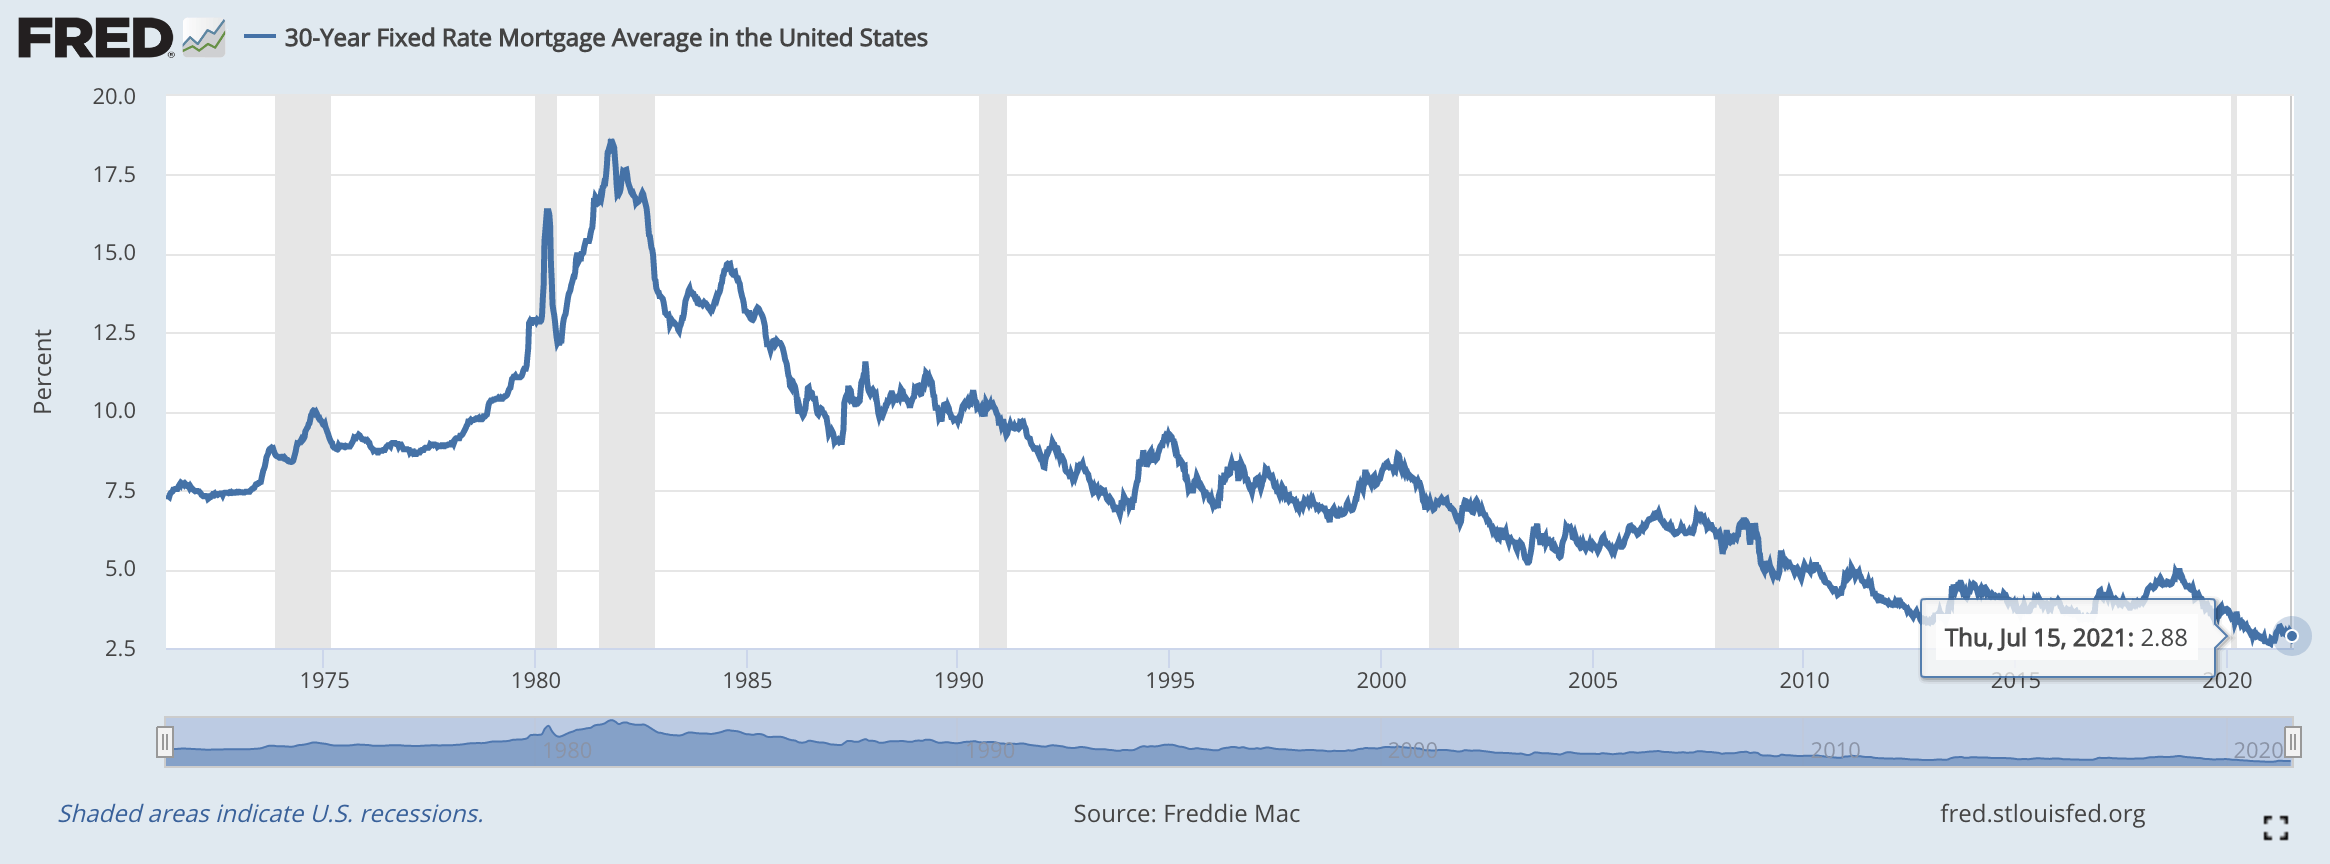
Mortgage rates are historically low and fueling demand for real estate. (Source: fred.Stlouisfed.org)
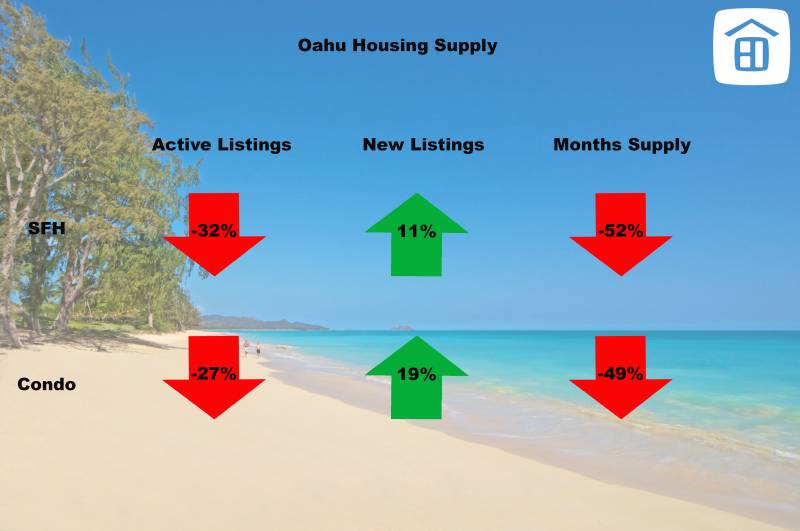
Oahu has a 1.2 months supply of single-family and 2.1 months of condominiums. This means that at the current sales rate, there would be no more homes for sale in 1-2 months. 6 months of supply is considered a “balanced market.” Anything less a “seller’s market” and greater than 6 months is a “buyer’s market.” (Source: hicentral.com)

With a tight supply and demand kept high with low interest rates, it is no wonder that Oahu’s average sales price hit $1,225,011 for single-family and $557,302 for condominiums in June. Up 36.2% and 15.8%, respectively. (Source: hicentral.com)
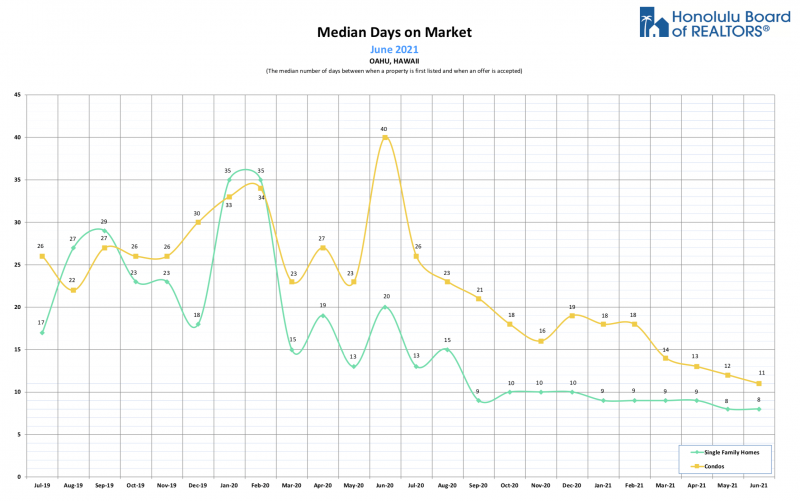
Days on market is a good measure of “market velocity” or how quickly homes are selling. In June, market velocity for single-family homes is about 8 days for SFH and 11 days for condos. These numbers are down about 60% for single-family homes and 73% of condominiums, year over year. (Source: hicentral.com)
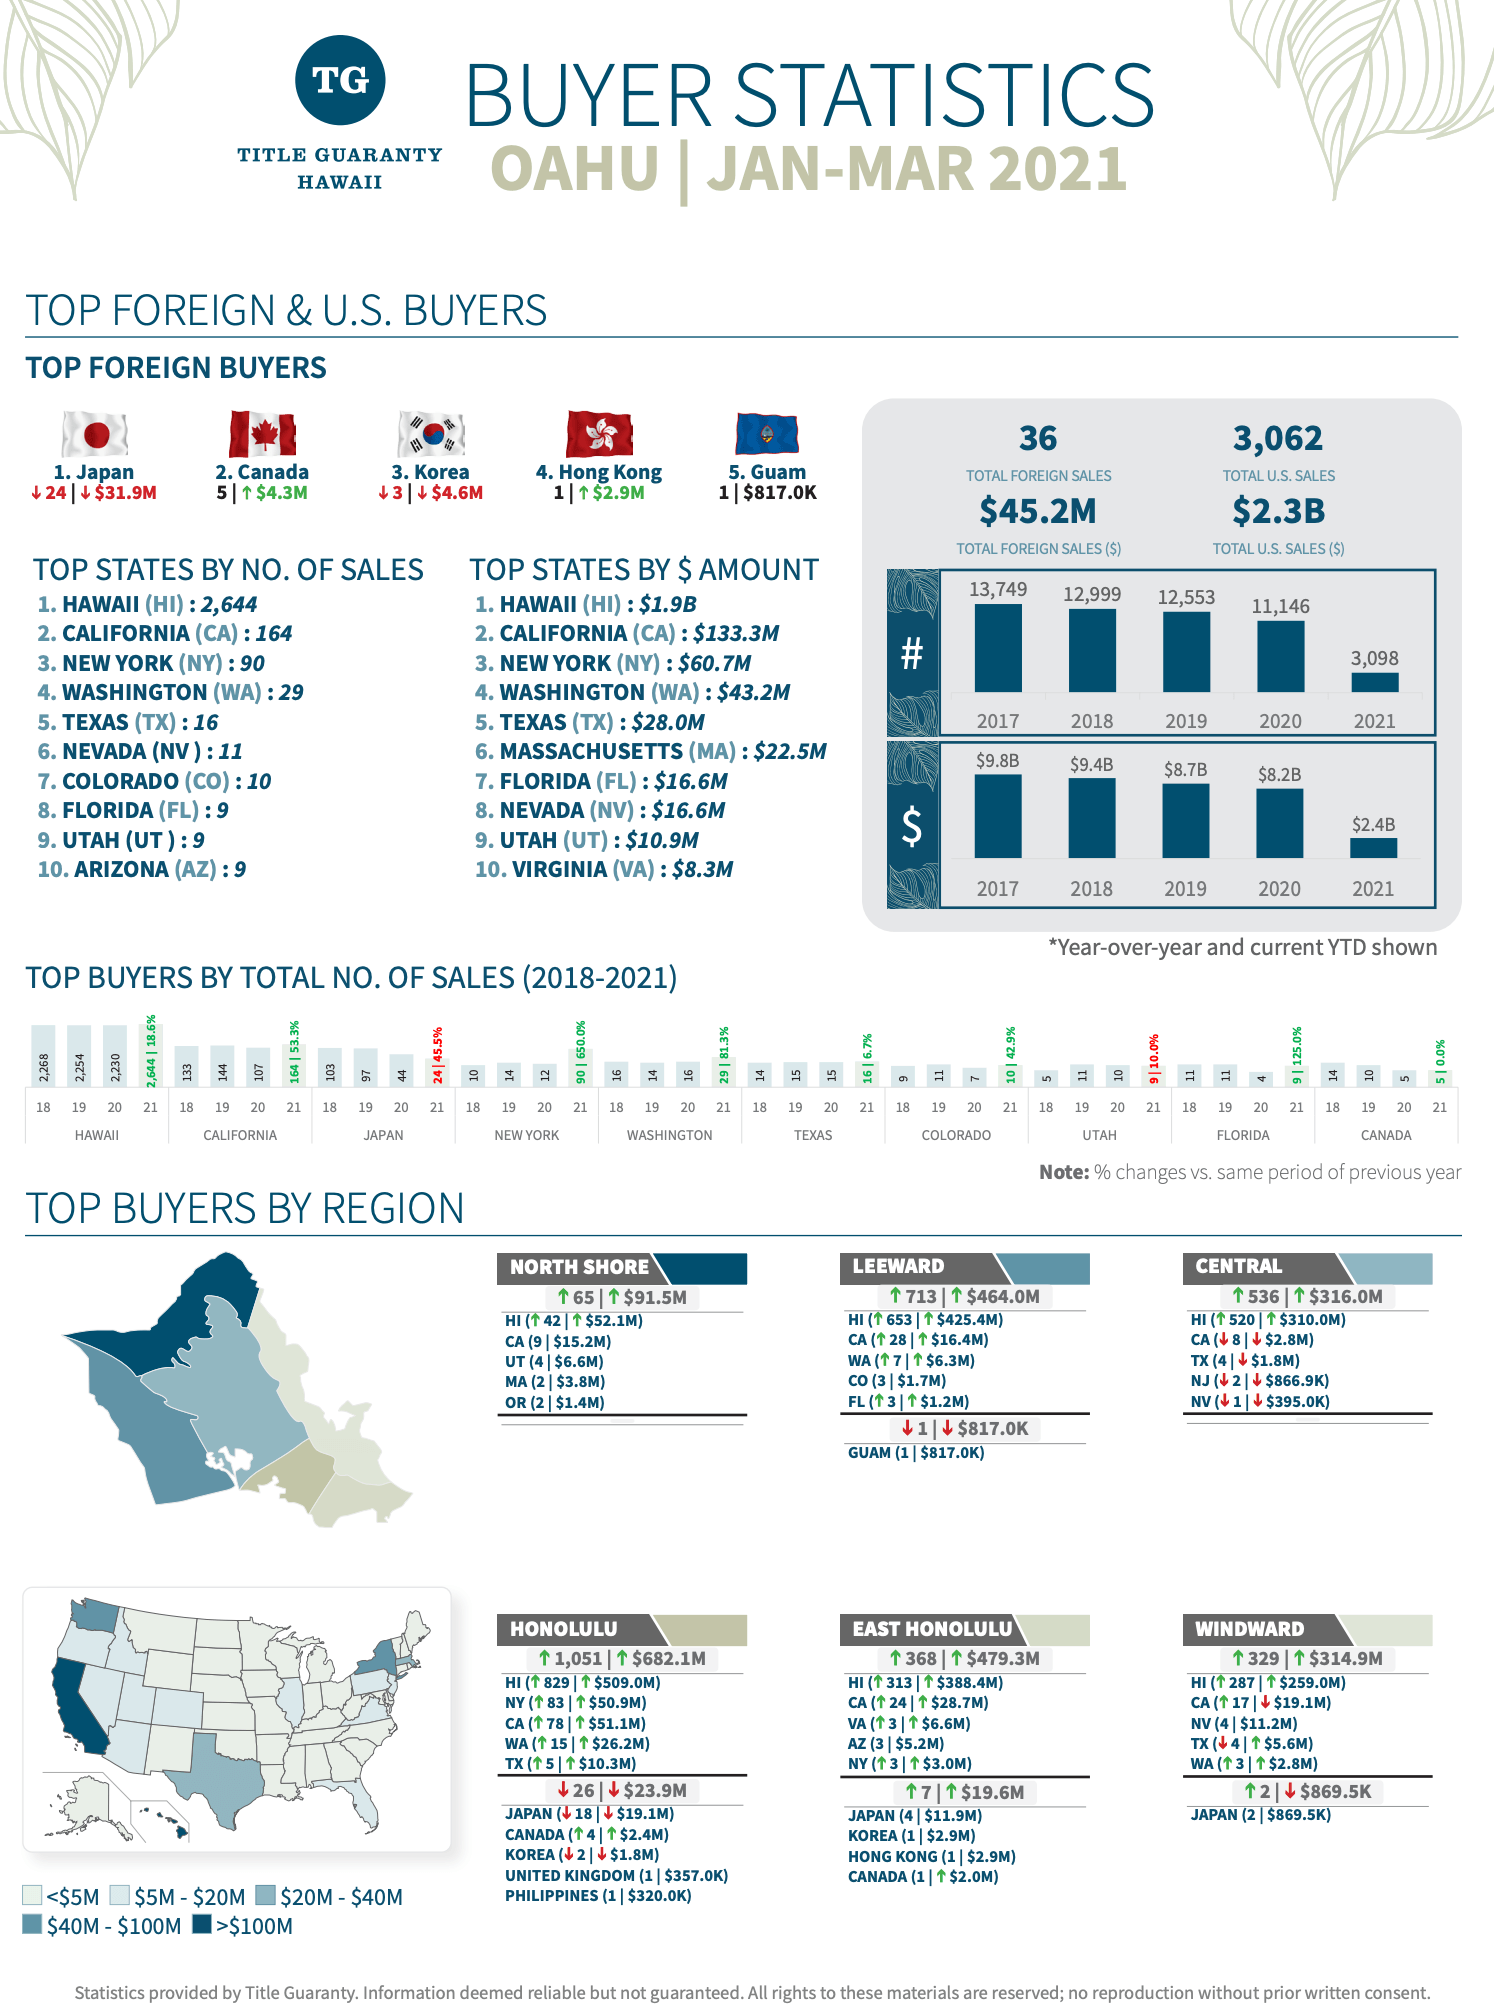
Where are Oahu’s buyers coming from? Foreign investment on Oahu, in the 1st quarter of 2021, is down ~62% to 83%, from the top investors of Japan, Canada & Korea, compared to first quarter totals in 2019. ~86% of the trades on Oahu are “local transactions” between residents of Hawaii. California and New York buyers represented 5% and 3% of sales volume in the first quarter of 2021.
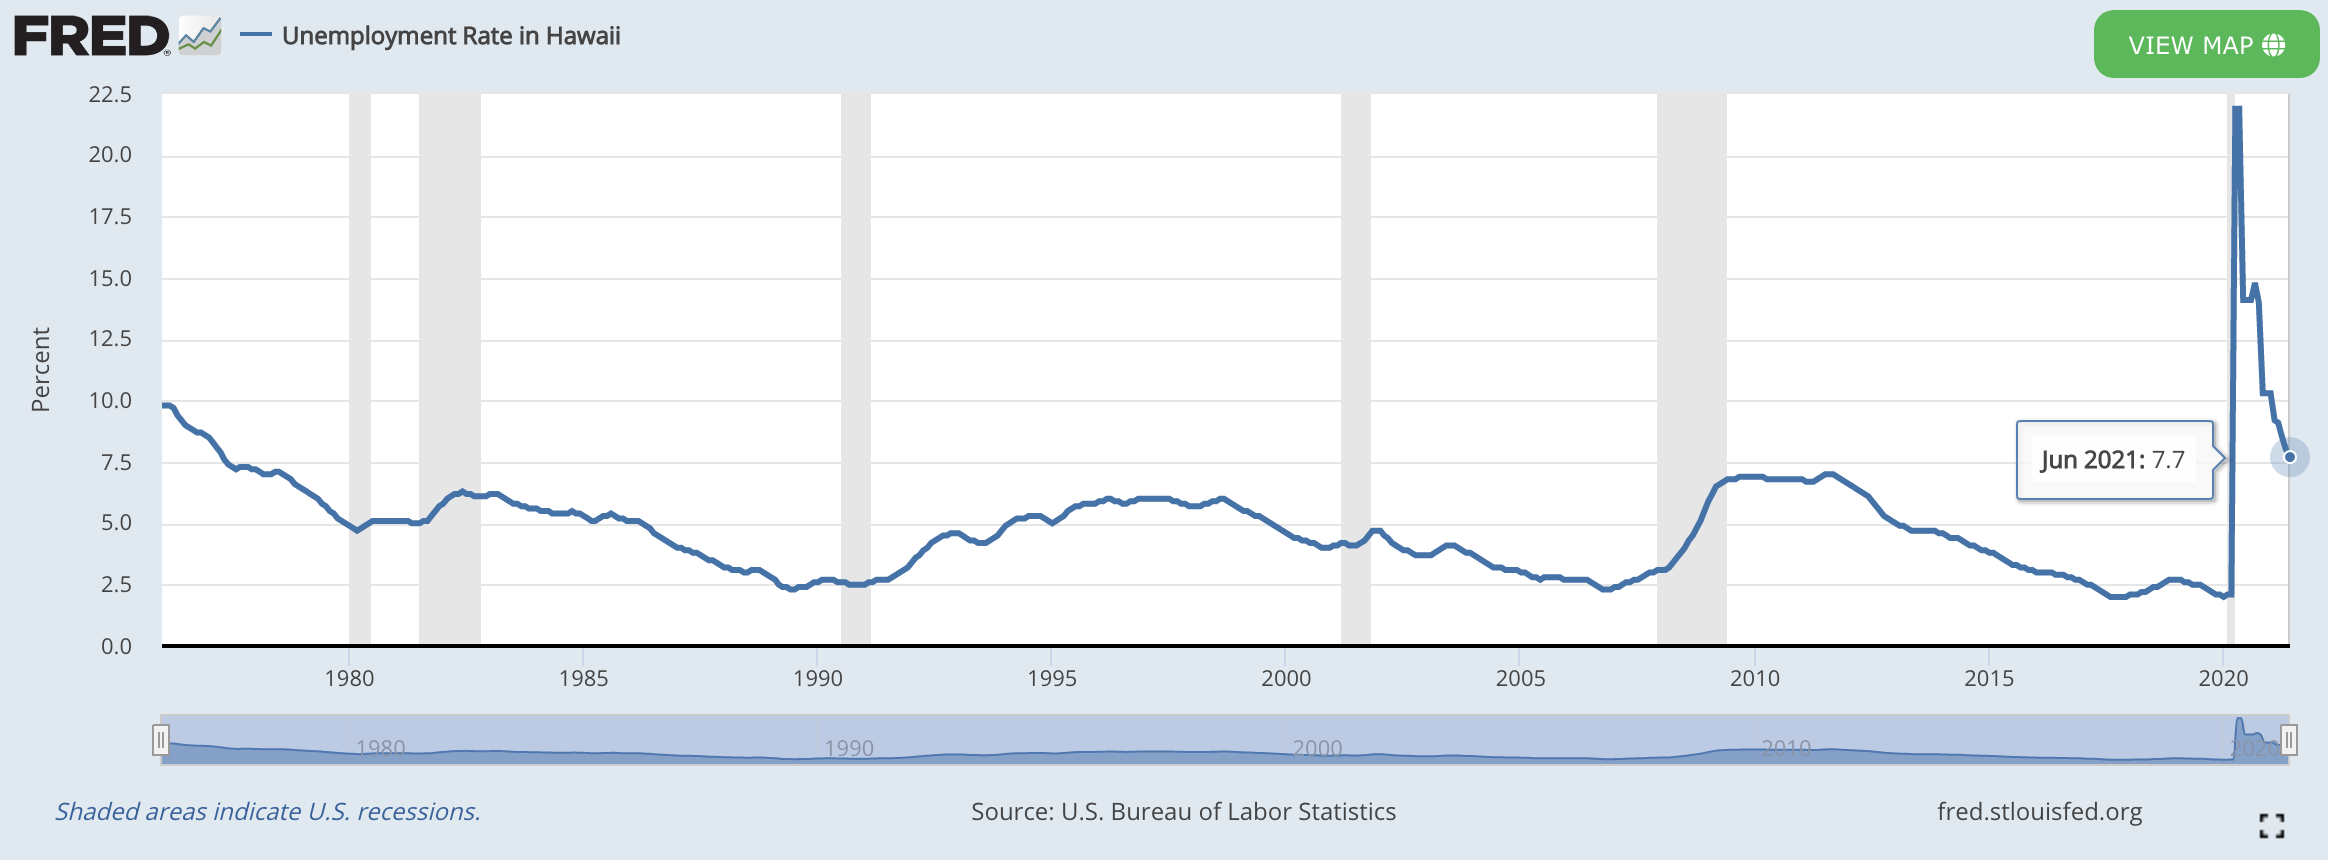
Hawaii’s unemployment rate has dropped from April 2019’s highs of about one in five people (~22%), down to 7.7%, as of June 2021. (Source: fred.Stlouisfed.org)
In summary, for the 2nd quarter of 2021, prices are up due to low supply and high demand. Properties are selling 60-73% quicker. The financial stress indicator is low, unemployment has come down from 1 in 5 people to ~8%, and Hawaii’s economy is within 10% of record levels prior to C19.
Aloha,
Jake

Burdi Real Estate
August 27, 2024
Fantastic post on navigating the real estate market! Your tips for selecting the best professionals are invaluable. Finding top realtors in Vaughan can make a huge difference in buying or selling a home. Thanks for sharing such practical advice—looking forward to more insights in future posts!