As part of my commitment to keeping the community informed about West Maui‘s micro-market real estate environment, I’m bringing you an up-to-date, comprehensive property market summary of Lahaina Residential, Front Street’s premier local beachside condominium community.
What You’ll Find
- Actual Sales Prices: learn exactly how much specific properties sold for
- Sales Volume: see the strength of the market in terms of how many properties sold
- Days on Market: understand how long it takes the average property to sell
- List Price vs. Sold Price: see how the final sales price compares to the listing price
- Price Per Square Foot: which is critical in calculating real estate values
- Asset % Growth: what is the year over year appreciation of my property
- Current Inventory: what is actively for sale and currently under contract
Before we dig into the numbers, make sure you subscribe to my blog if you want to be notified of future market reports as they come available.
Lahaina Residential 2019 Market Snapshot
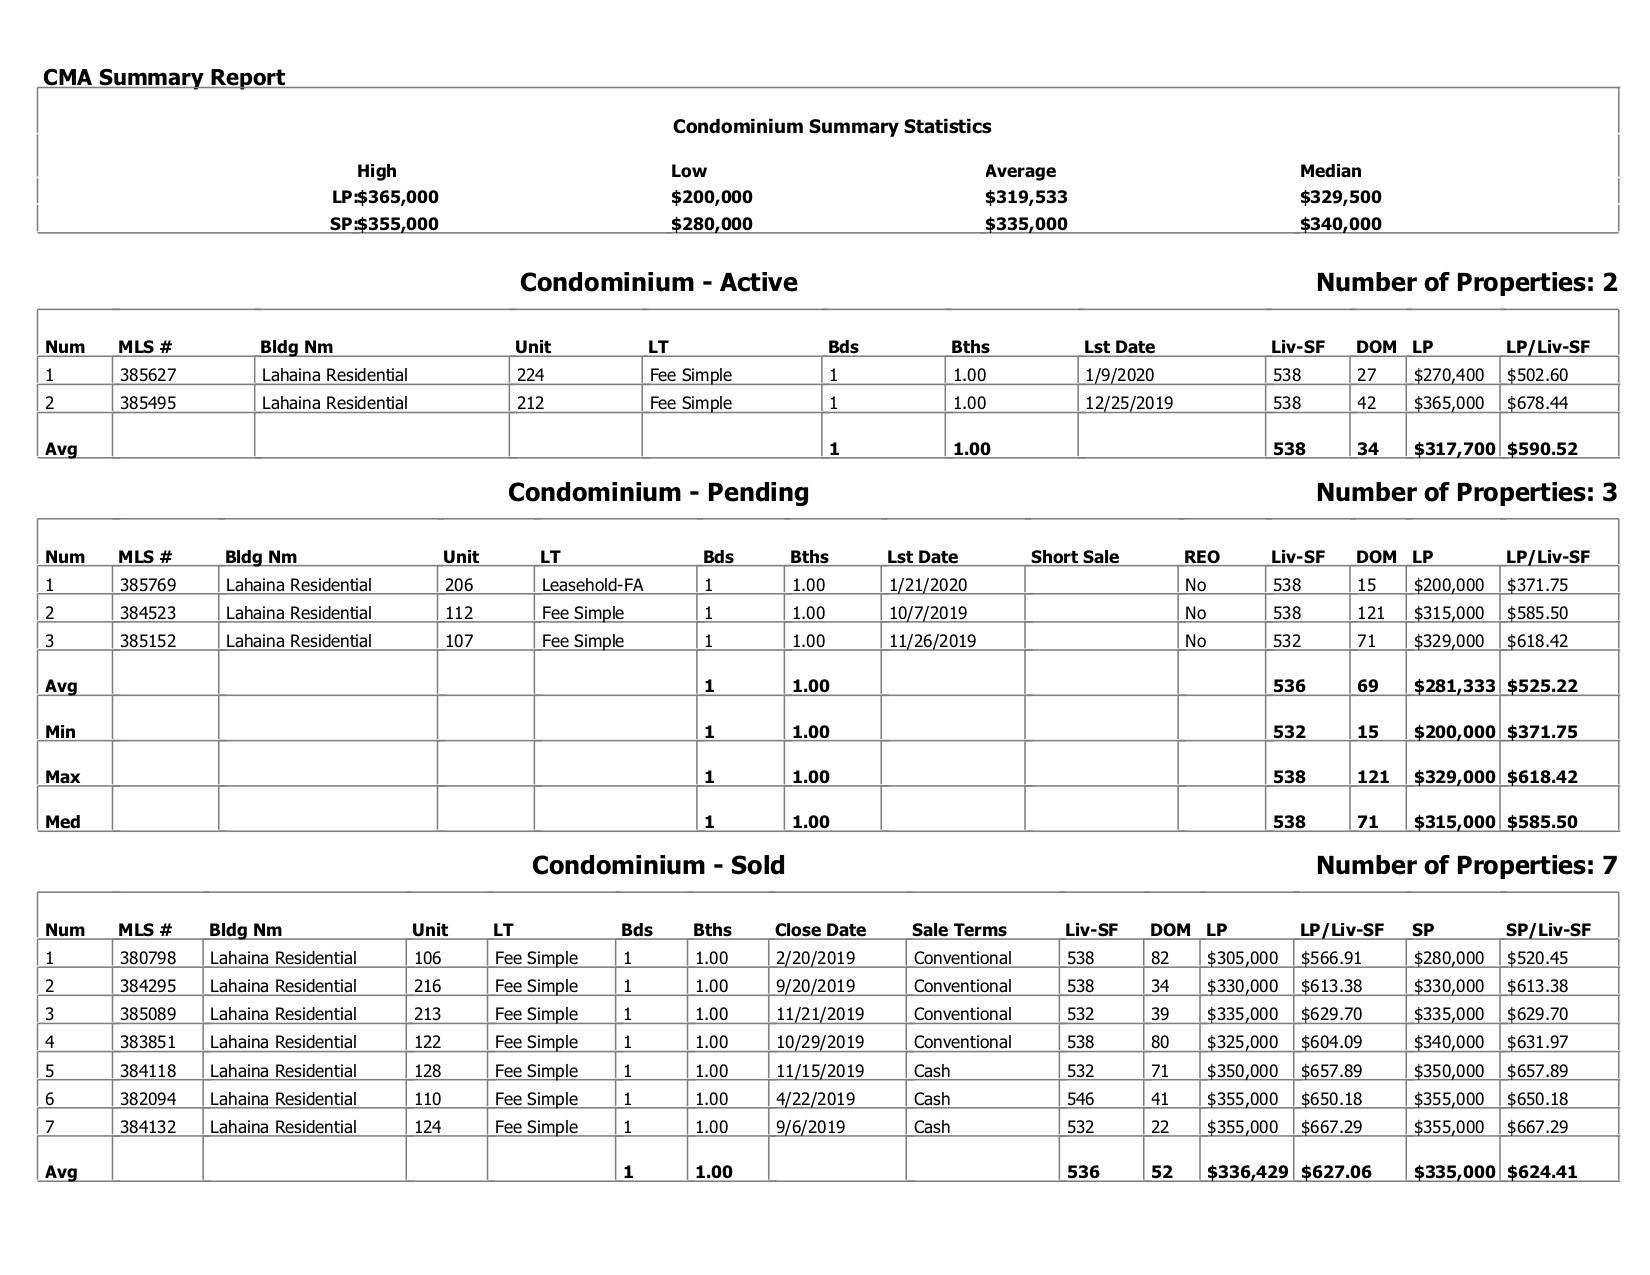
- When Lahaina Residential units have come to market this year, they have gone fast. With an average of ONLY 53 days on the market from listing to closing, Lahaina Residential is easily one of the most in demand residential condo communities in all of West Maui.
- Location, limited supply, and the recently lowered monthly maintenance fees are driving the 2019-2020 price spike. On the surface, average sales prices are up a gaudy 65% over 2018; However, it’s a bit misleading as 2 of the 3 in 2019 were some of the last remaining leasehold units.
- BUT – Fee simple units ARE trading at 20% over 2018, which is very strong ($335K vs. $279K). For more, see the historical analysis below.
- Currently, there are 2 actively listed units for sale and 2 under contract.
Lahaina Residential Historical Sales Summary
Click graphs for interactive
| Year | Avg List Price | Avg Sold Price | % List Sell | % Yr Gr | $/Sq Ft | DOM | # Sold |
| 2019 | $336,429 | $335,000 | 100% | 65% | $624 | 53 | 7 |
| 2018 | $213,667 | $203,000 | 95% | -27% | $377 | 98 | 3 |
| 2017 | $279,250 | $276,250 | 99% | 7% | $513 | 54 | 4 |
| 2016 | $267,000 | $257,500 | 96% | 44% | $479 | 83 | 2 |
| 2015 | $186,544 | $178,911 | 96% | -13% | $333 | 124 | 9 |
| 2014 | $179,417 | $204,750 | 114% | 30% | $381 | 176 | 6 |
Fee Simple Versus Leasehold Breakdown
|
Fee Simple
|
|||||||
| Year | Avg List Price | Avg Sold Price | % List Sell | % Yr Gr | $/Sq Ft | DOM | # Sold |
| 2019 | $336,429 | $335,000 | 100% | 20% | $624 | 53 | 7 |
| 2018 | $287,000 | $278,500 | 97% | 1% | $518 | 169 | 1 |
| 2017 | $279,250 | $276,250 | 99% | 7% | $513 | 54 | 4 |
| 2016 | $267,000 | $257,500 | 96% | 14% | $479 | 83 | 2 |
| 2015 | $235,475 | $226,125 | 96% | 10% | $420 | 63 | 4 |
| 2014 | $179,417 | $204,750 | 114% | 17% | $381 | 176 | 6 |
|
Leasehold
|
|||||||
| Year | Avg List Price | Avg Sold Price | % List Sell | % Yr Gr | $/Sq Ft | DOM | # Sold |
| 2019 | 0 | ||||||
| 2018 | $177,000 | $165,250 | 93% | 17% | $307 | 63 | 2 |
| 2017 | 0 | ||||||
| 2016 | 0 | ||||||
| 2015 | $147,400 | $141,140 | 96% | 117% | $262 | 174 | 5 |
| 2014 | 0 |
Lahaina Residential 2019 CMA Market Report
Want to Know More?
If you are in the market for buying or selling Lahaina real estate or have any questions about the area or the market in general, please feel free to contact me. I welcome the opportunity to give you information on my previous sales performance and marketing strategies. Or if you’re curious about what your property is worth in today’s market, it would be my pleasure to provide you with property information and a value assessment free of any sales pitch.
Related Articles:
Beaches, Bikini’s & A Foreclosure | Recommended By Me, Not Listed By Me
Strong Demand & Increased Prices Continue At Lahaina Residential

Leave your opinion here. Please be nice. Your Email address will be kept private, this form is secure and we never spam you.