In summary, housing prices remain stable, despite demand taking a hit, as interest rates have more than doubled in the past 14 months. Nationally, we saw the first single-digit price gain in 2 years. Continued rapid deceleration with only 13 states having double-digit growth. Supply indicators continue to surge dramatically in comparison to the “greatest years” in real estate, but still remain historically low. Closing volumes continue to shrink as the real estate market contracts. UHERO is forecasting a US recession for 2023, but feels Hawaii will likely be spared due to increased foreign travel and the Infrastructure Investment and Jobs Act. Inflation appears to have peaked in Summer ’22 and oil prices return below what they were when Russia first invaded Ukraine. Seats from Japan are scheduled to increase by 318% in the next 3 months. Market velocity is at about 1 to 1.5 months to sell property and Hawaii continues to maintain Pre-Covid visitor expenditures & economic activity numbers into 2023.
Price Appreciation
If we look at the big picture, US house prices rose 8.4% on average, in the 4th quarter of 2022, year over year. Positive increase in all 50 states, but a .8% decrease in the District of Columbia.
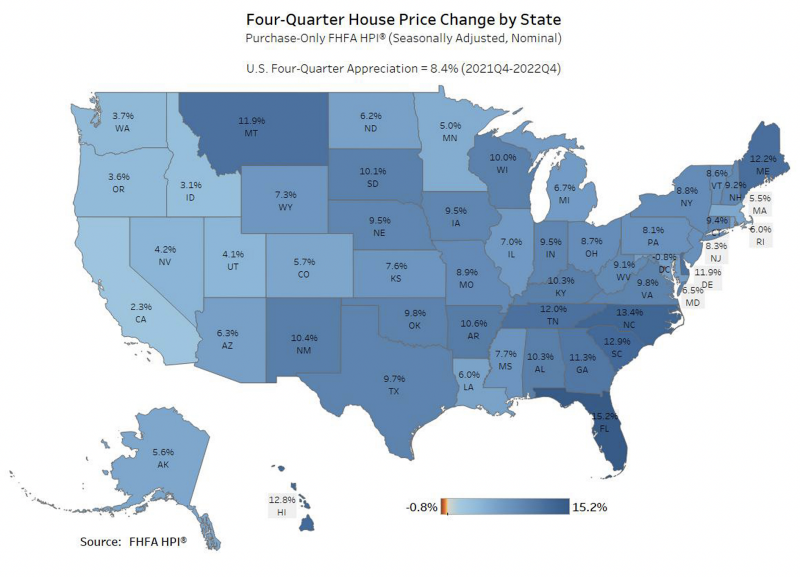
The 4th quarter 2022, marked the end of a 2 year, national run of double-digit price growth. It is the 44th straight quarter of positive annual price appreciation. We have not seen a negative price change in over a decade, since 2012. However, a rapid deceleration in price growth continues to be evident and will be visible in further charts in this report (FHFA.gov)

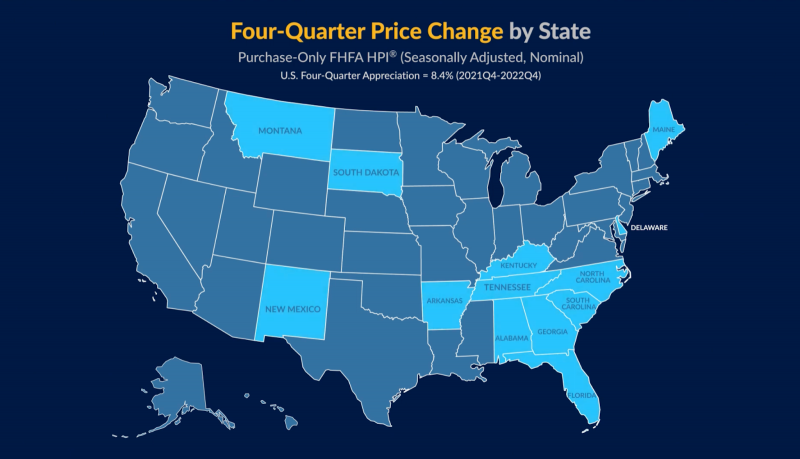
In Q4, we saw price growth in all 50 states (excluding the District of Columbia -.8%). In the 4th quarter, all 50 states continued to have positive price appreciation, but only 13 states saw single-digit price growth.
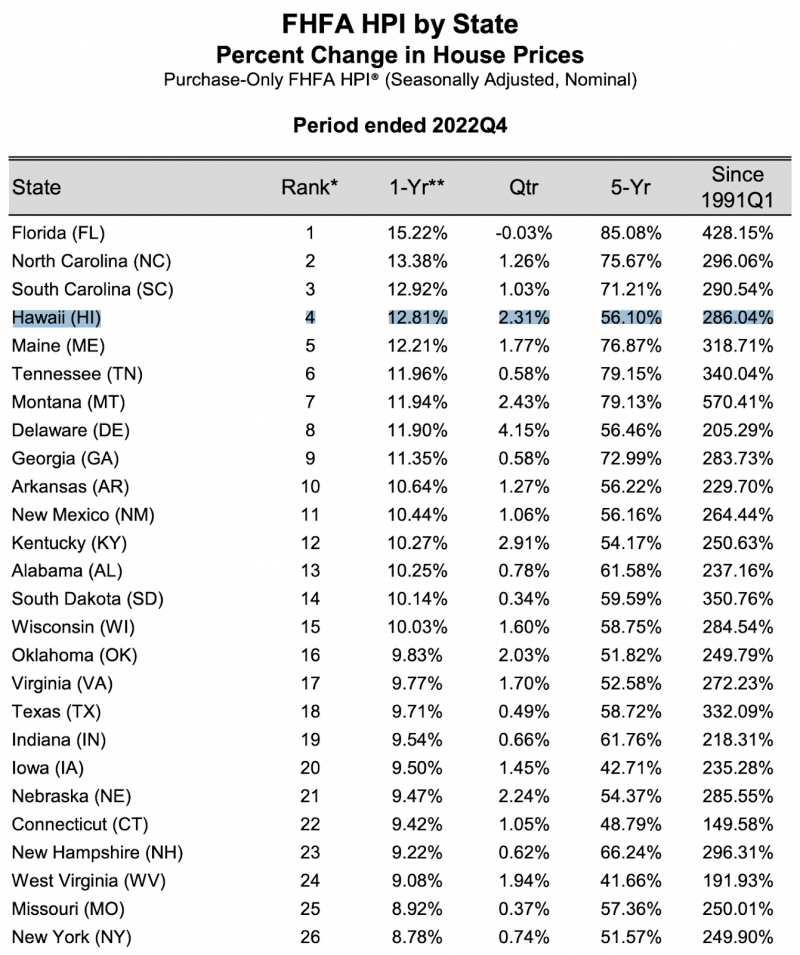
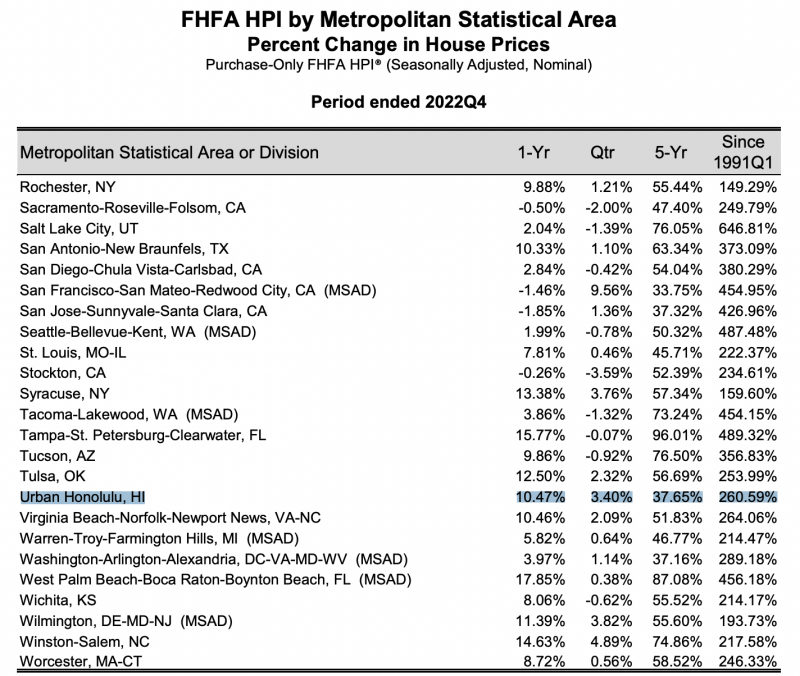
The state of Hawaii is ranked 4th, in the country, with 12.8% price appreciation YOY.
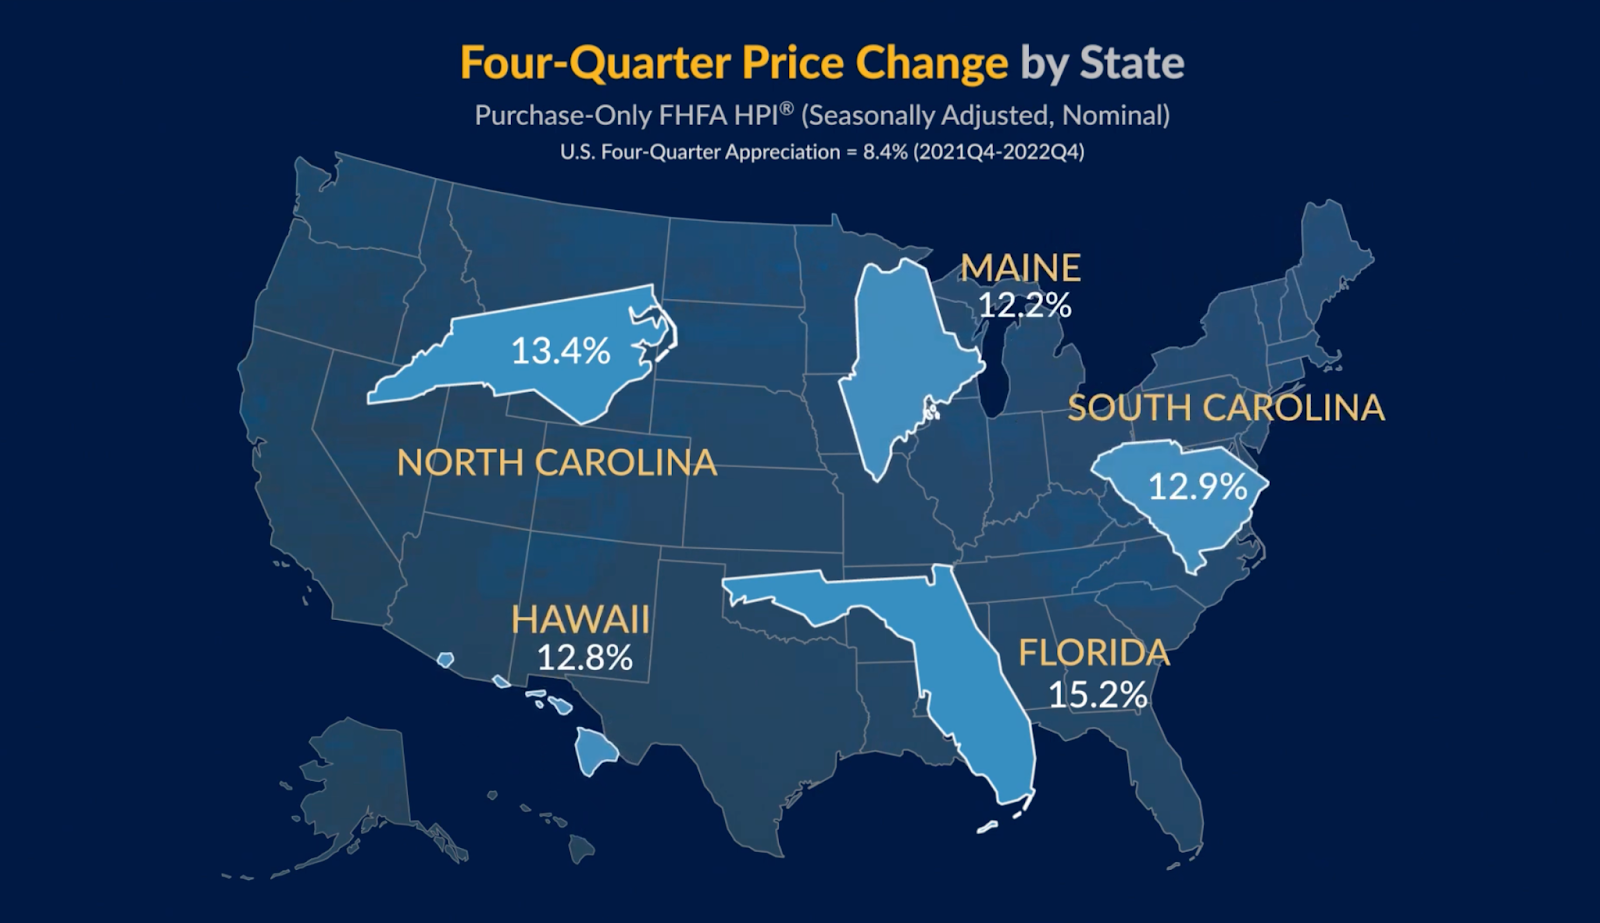
Florida and North Carolina lead the charge with 15.2% and 13.4%, respectively.
In the chart below, we can see the 13 states that only saw single digit price appreciation. Evidence of price growth deceleration:

Price Change By City
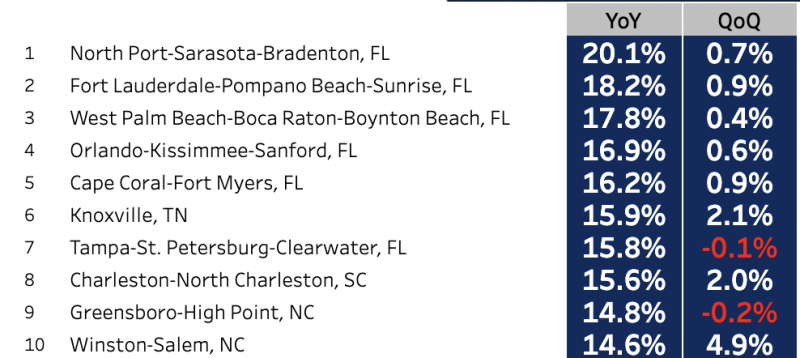
The City and County of Honolulu is up almost 10.5%, year over year. Honolulu is ranked 28th after cities like, #1, North Port-Sarasota-Bradenton, FL, up 20% and #2, Fort Lauderdale-Pompano Beach-Sunrise, FL, up 18% (FHFA.gov).
Six of the top 10 cities for price appreciation were in Florida.
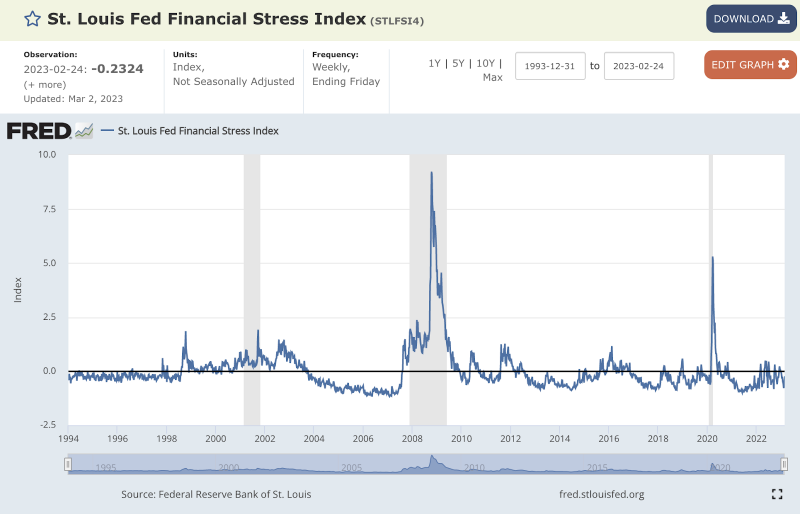
Financial Stress Index
The nation’s Financial Stress Index on February 24th, 2022 was -.23 points. This number is up half a point in the past month, with increased interest rates, inflation, gas prices, etc. The Financial Stress Index is significantly lower compared to our last three recessions highlighted in gray. Where the index was at 5.48 points in 2020, and nearly 9 points during the financial meltdown of 2008.
Months Supply
The supply indicators in February 2023, continue to be indicative of a market in flux and change. The figures where single-family homes jumped 57% in active listings and 122% in months supply, need to be taken with a grain of salt, because these numbers are being compared to February 2022, which was one of the greatest years in real estate history. It is also important to note, that months supply is still ridiculously low at just above ~2 months of supply. 6 months is considered a balanced market.
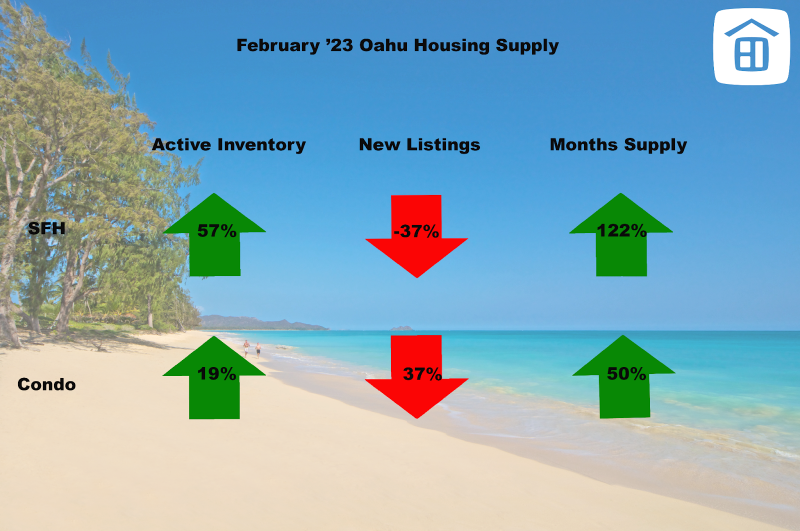
Months supply is still very low and below 6 months, is considered a “seller’s market”
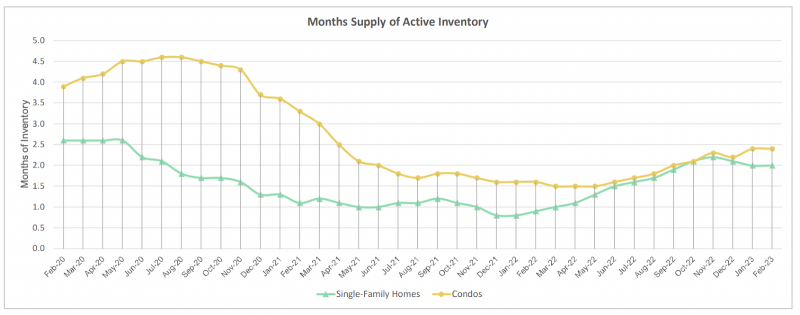
Source: HicentralMLS
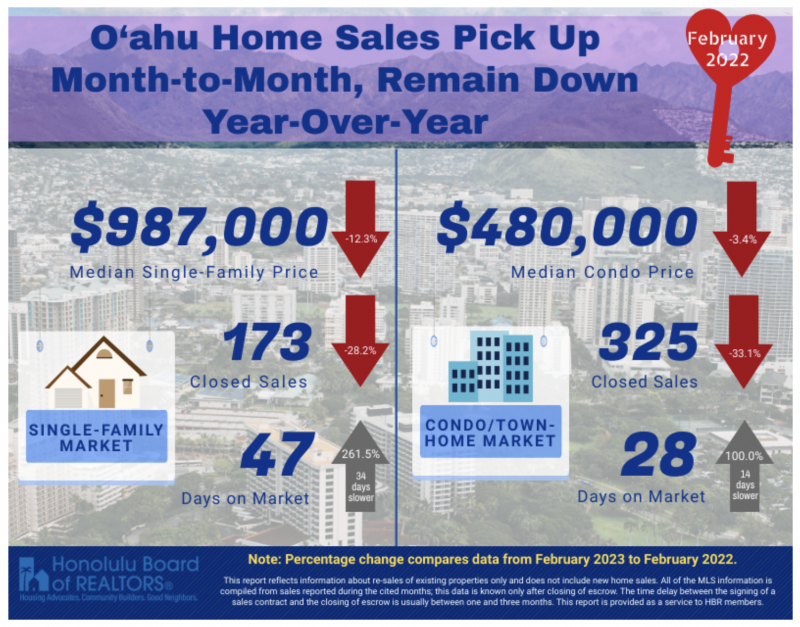
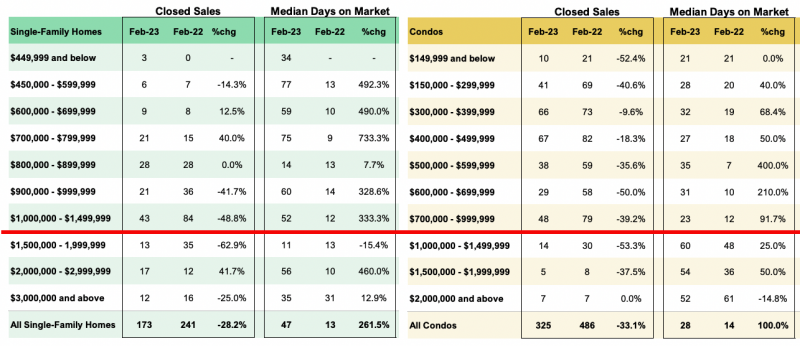
Sales Volume
Median sales prices are down 12.3%, for single-family, and down 3.4% for condominiums. Sales volumes are off around 28% & 33% for single-family an condos, respectively. In February, days on market grew around 30% to a month and a half to sell single-family and a month for condos.
In addition to the market slowing, it appears we have also seen a return to the normal, cyclical patterns of real estate. Where the 4th quarter typically slows and only accounts for ~10% of the annual sales volume. The typical seasonality of real estate consists of a “Spring/Summer selling season” followed by a slower 4th quarter. The 4th quarter is slow, because families are traveling and hosting parties for Halloween, Thanksgiving, Christmas and New Years. During COVID, the traveling and parties were cut out, so real estate activity continued all year.
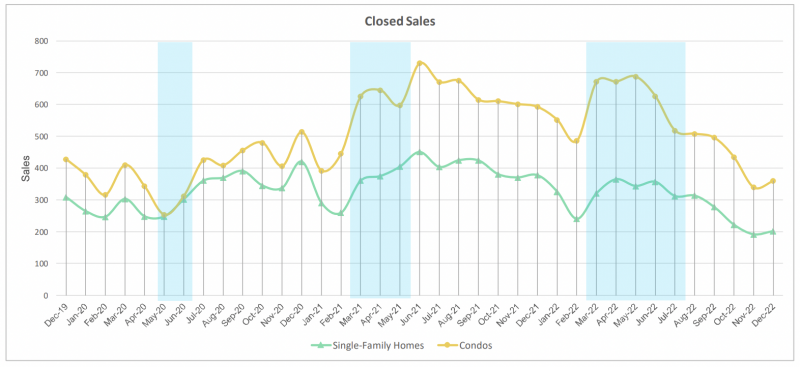
Traditionally, we see the closing volume of single-family homes and condominiums move in lockstep with each other. When covid hit in the Spring of 2020, we saw a sharp decline in the closings and demand for condominiums (highlighted in blue). Perhaps, largely attributable to the desire for people to not have shared HVAC systems, common amenities & shared elevators. This was the first time in recorded Hawaii real estate history, where we witnessed the “decoupling” of single-family homes and condominiums. We can see further highlighted examples, where closings are moving independently of each other.
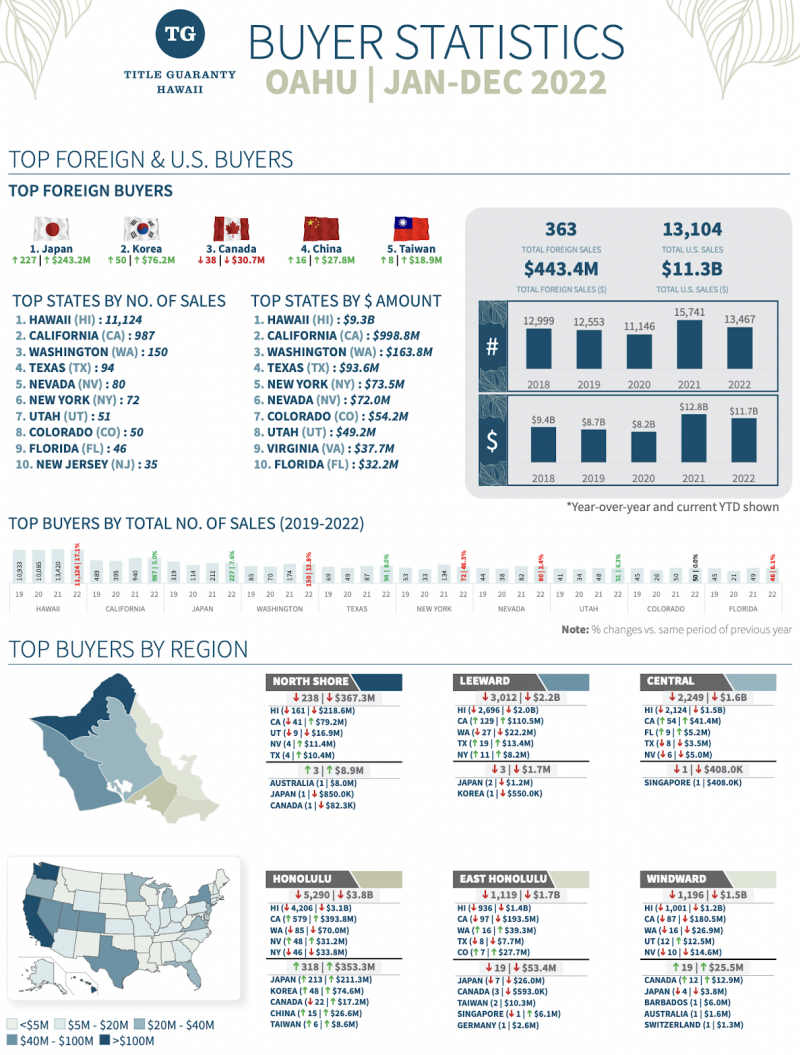
Who Is Buying Hawaii Real Estate?
For the entire state of Hawaii, just over 21,000, or $18.6B, of real estate transactions occurred in 2022. Fully 75% of the buyers were Hawaii Residents and 2% were foreign buyers. The next largest group of buyers were from California, at ~10%. Japan was the top foreign buyer, totaling almost $256M over 231 sales (Title Guaranty Hawaii)
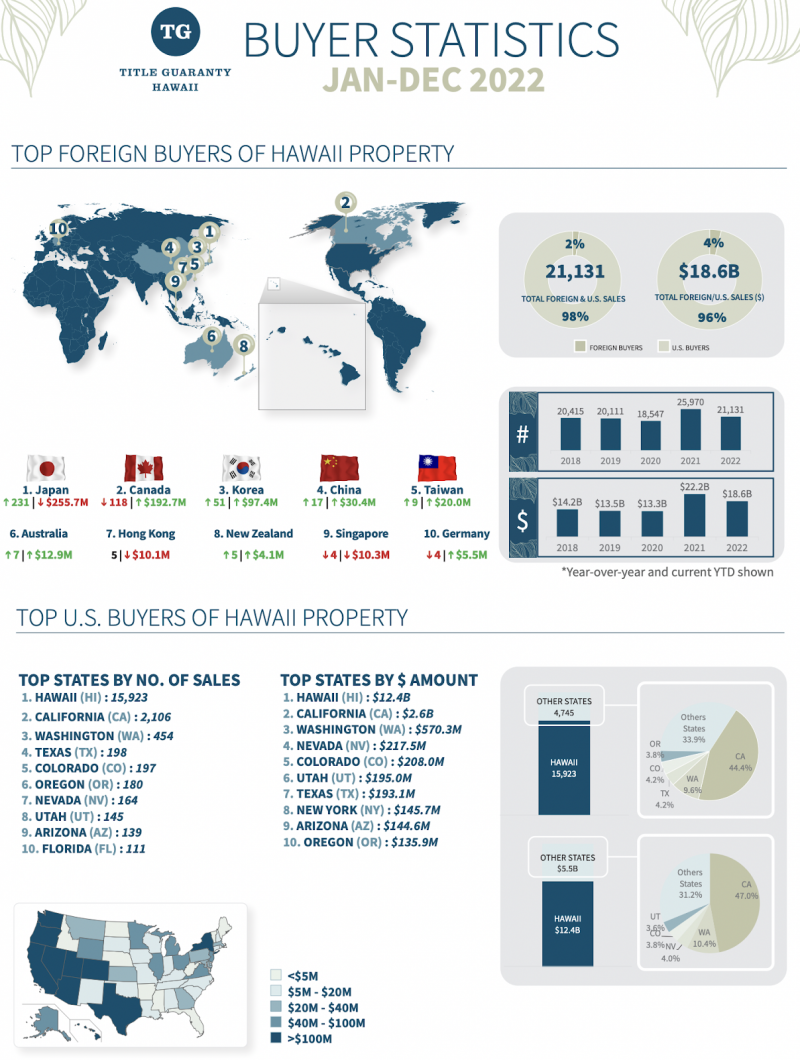
On Oahu, fully 82% of the transactions were Hawaii resident buyers. The next largest total of purchases came from California, at ~7%. Japan is by far the number one foreign investor on Oahu. 3 to 4x the closed sales volume and dollar amount invested, respectively. 98% of Japanese investment volume numbers occur on the island of Oahu (TG Hawaii). Japanese travel is scheduled to increase 318% in the next 3 months (HTA & DBEDT).
Visitor Arrival Patterns
We can see how “revenge travel” arrivals from the US ramped up sharply in 2021, to pre-covid numbers. In 2022, we just saw the beginning of arrivals from Japan, coming back.
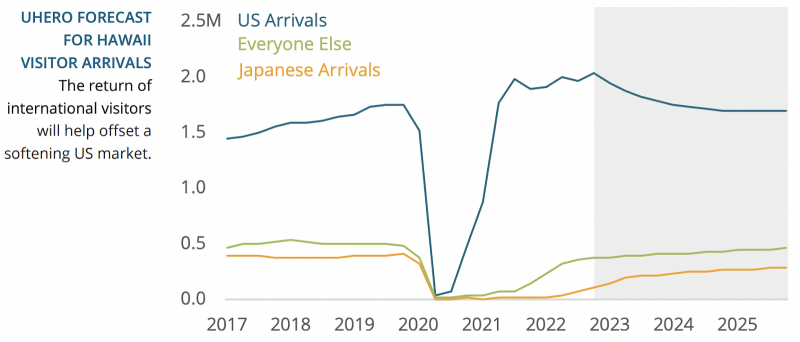
Another chart demonstrating where our arrivals have been coming from and how Japan has been lagging badly (UHERO). Seats from Japan are currently scheduled to increase 318.3% from March to May 2023 (HTA & DBEDT).
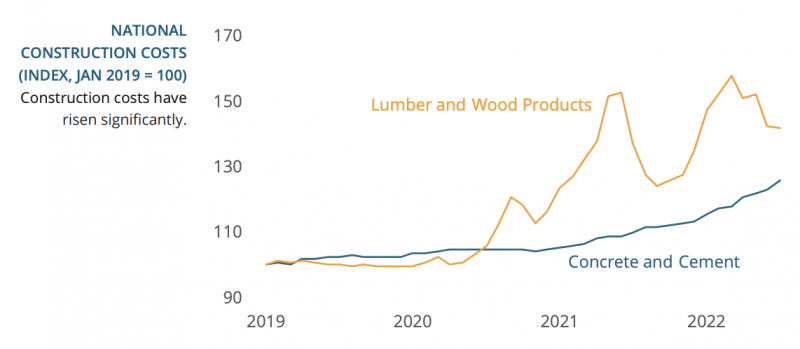
Construction Costs
This chart demonstrates the changes that have been occurring in prices for home building materials.
Source: UHERO
Price Growth
We had an average price appreciation of 8.4%. We can see on the chart below, that this is the first time we have not had double-digit growth since 2020Q3. The rate of price growth hovered around 20% for 5 consecutive quarters and now has started to come back down.
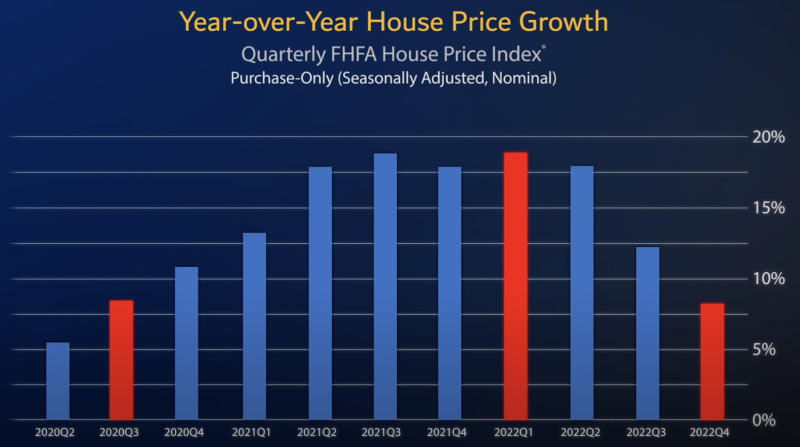
The 4th quarter, marked the 44th straight quarter of price growth appreciation, since 2012.
Price Points
For single-family homes, we see a sweet spot from $1-1.5M, where the predominant amount of closings are occurring. For condominiums (yellow chart), we can see a sweet spot at $700-999k. The number of closings decreases beyond that point.
Interest Rates
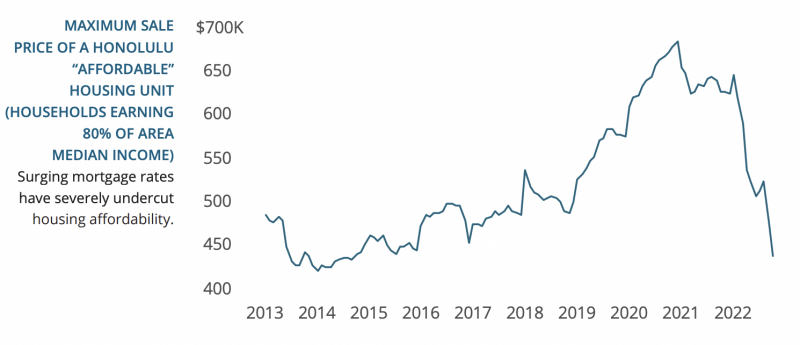
Interest rates hit a 50 year low in January 2021, of 2.65%. 14 months later, in March 2023, interest rates had more than doubled to 6.65%. Interest rates have been a W-shaped bounce-a-thon and peaked in October 2022 just above 7%.
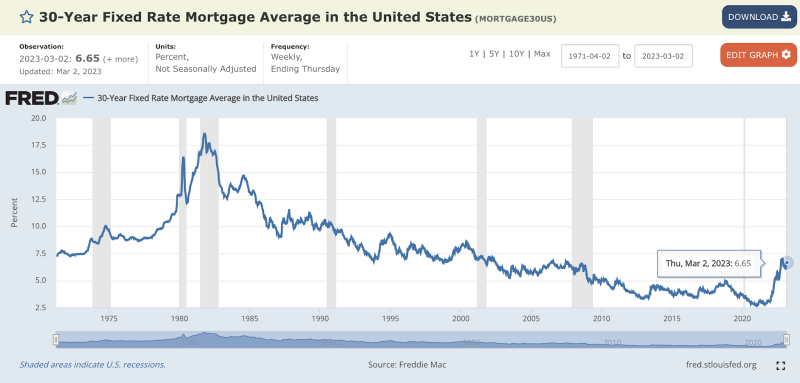
This sharp increase in interest rates, has translated into buyer’s purchasing power to go off a cliff
Source: UHERO
Inflation
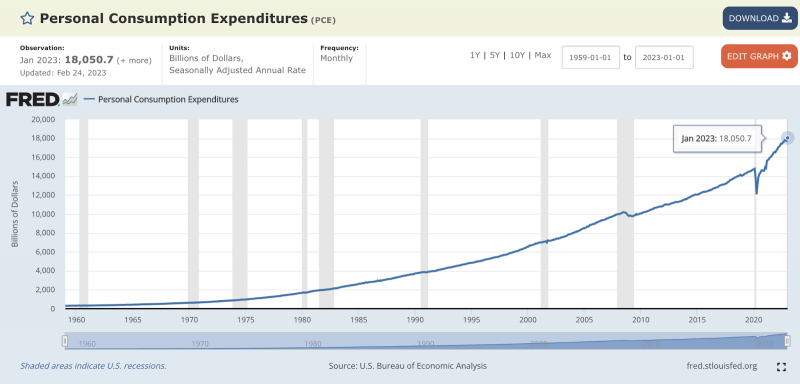
The rising cost of money is a result of the FED trying to tame inflation. Personal Consumption Expenditures are up 33%, since the onset of Covid.
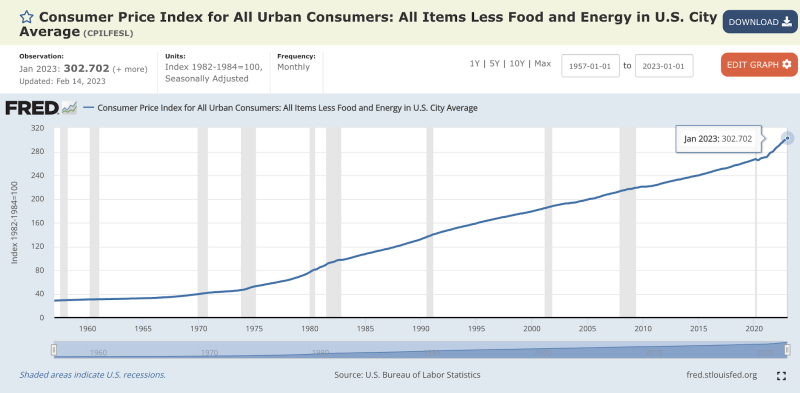
Consumer prices index is up 12% since COVID.
Owning real estate is a good hedge against inflation.
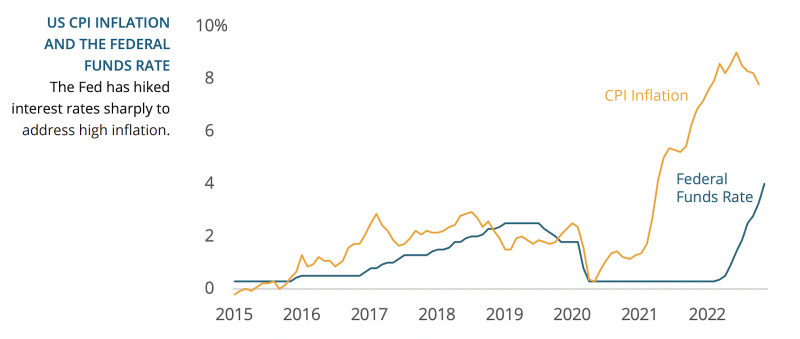
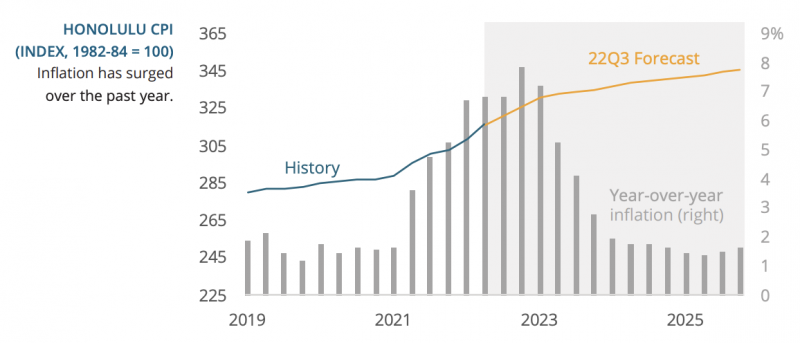
CPI peaked over 9% in the Summer of 2022. UHERO says, “The longer we see elevated inflation rights, the higher the probability of a mild recession in the US.”
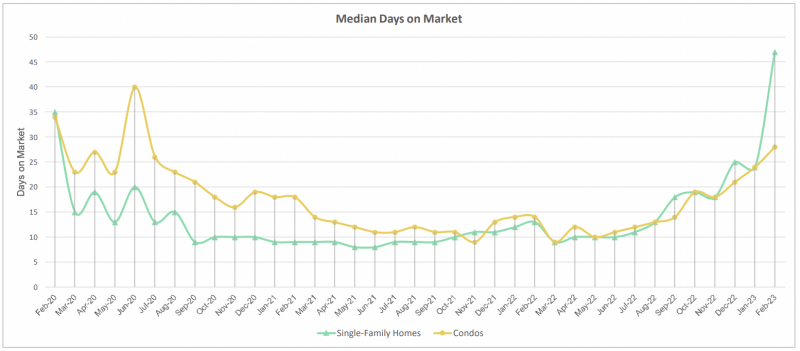
Days on Market (Velocity)
Days on market is a good measure of “market velocity” or how quickly homes are selling. In February, market velocity for single-family homes and condominiums were 47 & 28 days, respectively (~1 to 1.5 months to sell property!). Last February, it took a fraction of the time to sell a single-family home (~ 2 weeks). A 262% market velocity decrease for single-family and 100% decrease for condos.
Economic Activity
The line in the graph represents an index that tracks Hawaii’s economic activity. We can see the last 6 US recessions highlighted in gray. Since November of 2019, the index dropped 39%. In October 2022 (124 pts), we finally eclipsed our previous Pre-Covid, all-time highs (123 pts). In December, we almost reached 125 pts.
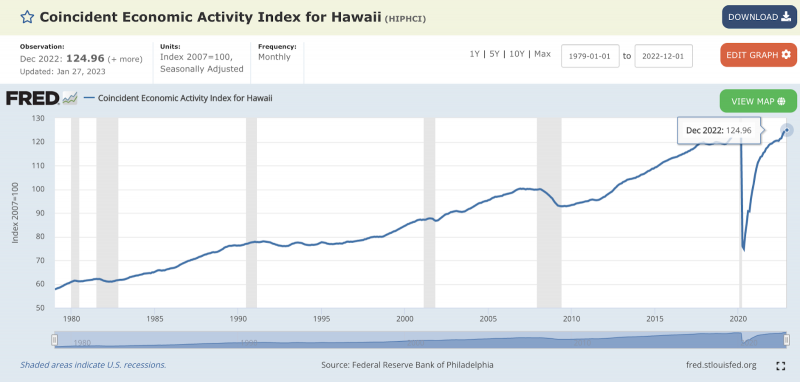
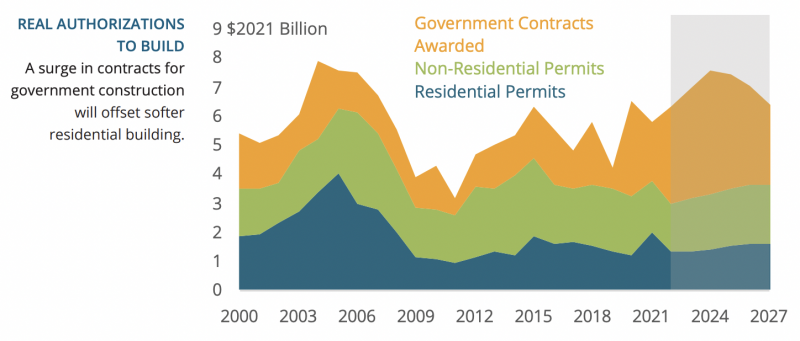
Our economy has finally reached pre-covid levels as a result of increased arrivals and a return to normal levels of visitor spending. Another boost has come from the FED in the form of ‘Infrastructure Investment and Jobs Act.’ In the chart below, we can see the drop off of residential and non-residential building permits and subsequent ramping up of government contract awards. These awards will likely keep Hawaii out of a recession (UHERO).
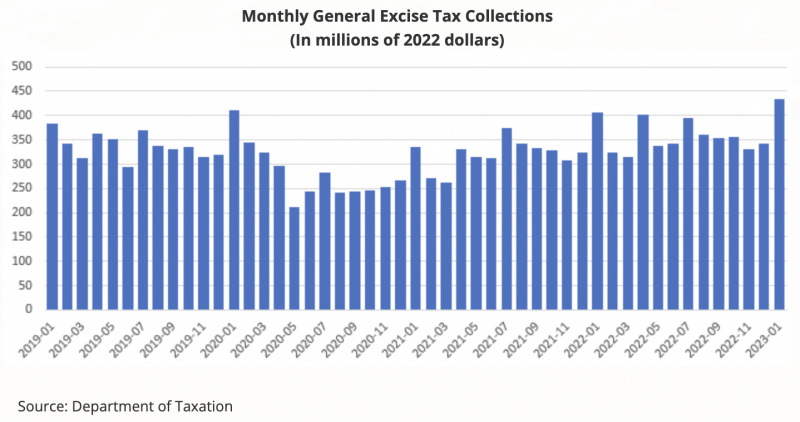
General Excise Tax Collection
January 2023 marked the 22nd consecutive month that GET grew at double digits due to higher inflation and economic growth.
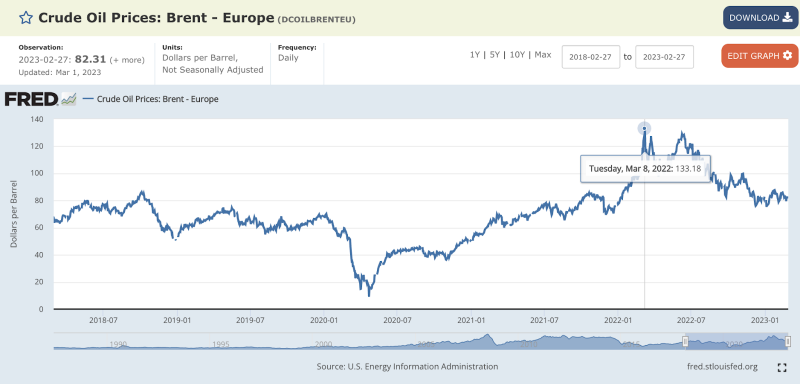
Crude Oil Prices
The price of oil has returned below the prices it jumped up to following the Russian invasion of Ukraine on 2/24/2022.
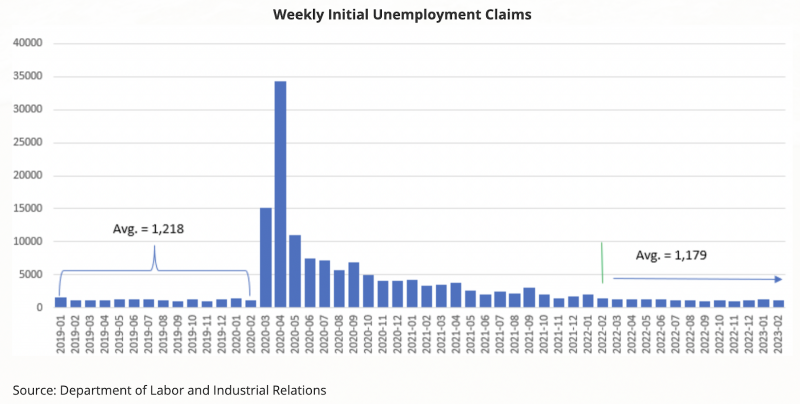
Unemployment
Labor market is stable, however a labor shortage still exists.
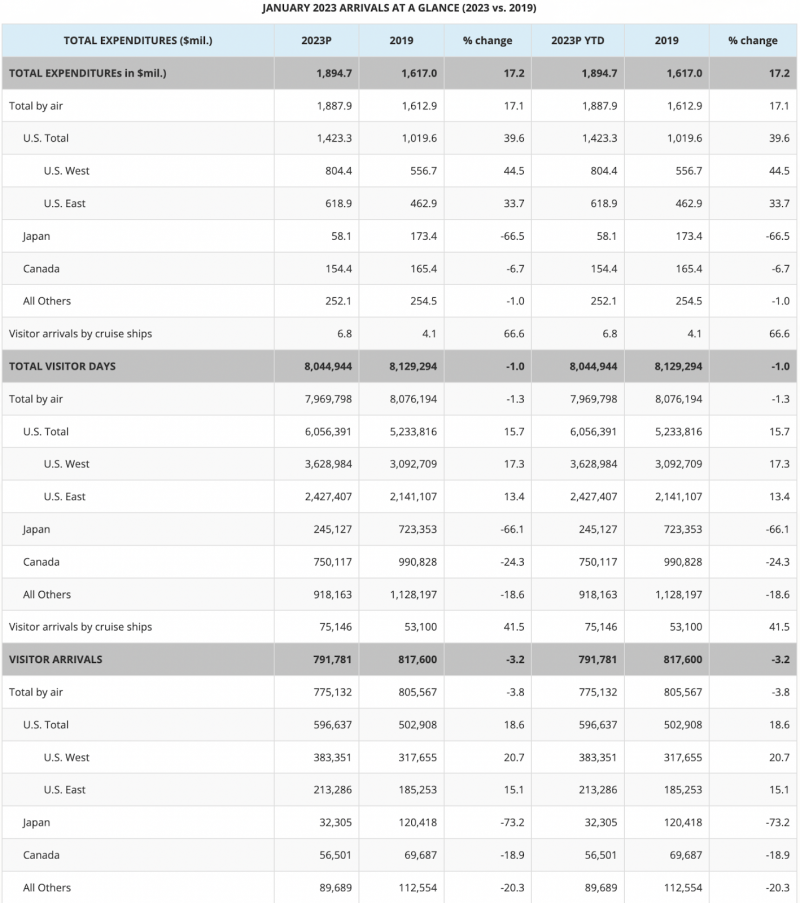
Visitor Spending, Days & Arrivals
Visitor expenditures hit a new record high, through November, 2022, were +17.2% higher than the same period, 2019. Visitor Days are within ~1% of pre-Covid numbers. Visitor Arrivals ~3.2% lower than pre-Covid. These visitor statistics hopefully will find pre covid numbers when the anticipated foreign travel begins to ramp up.
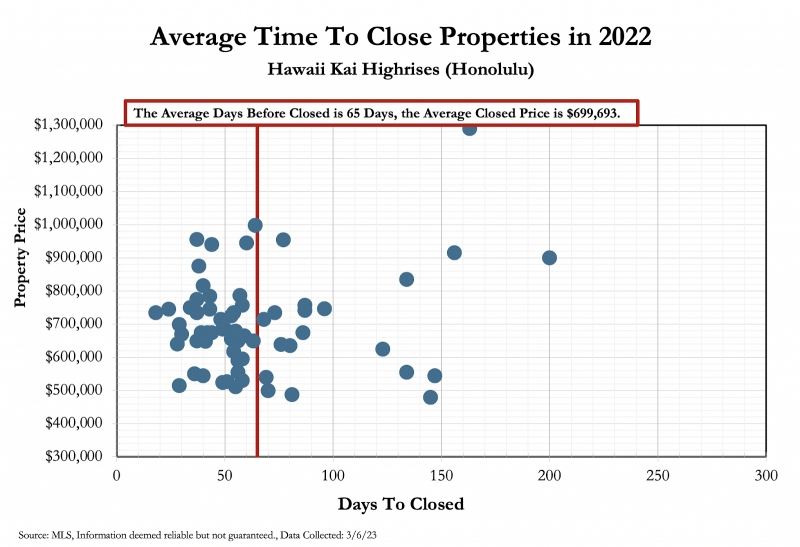
Hawaii Kai Highrises – Market Analysis
The following charts represent all studio, Fee Simple closings on the Gold Coast over the past 2 years.
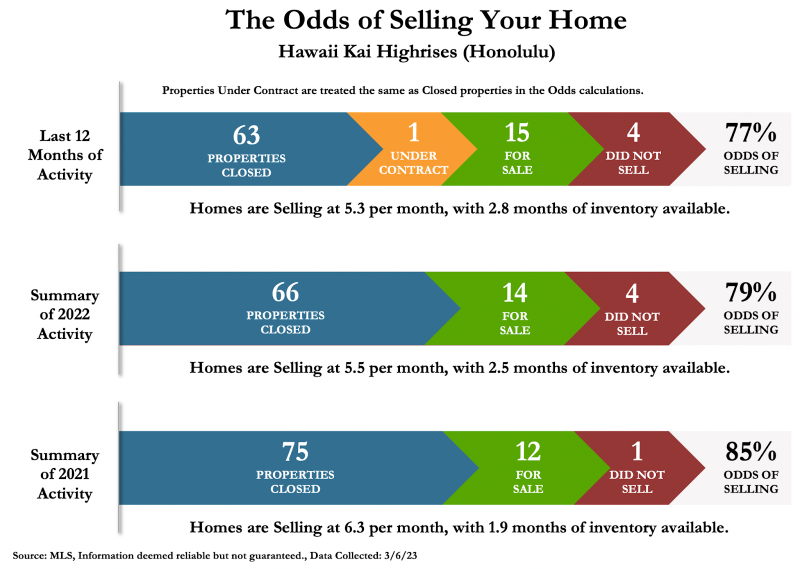
In the Odds of Selling Chart, we can see that in “The Summary of 2021 Activity”, 75 properties sold (blue), 12 properties were still “for sale” at year’s end (green) and 1 unit “did not sell” (red). Units were selling at 6.3/month and there was 1.9 months supply of inventory. Given these numbers, you had a 85% odds of selling.
In “The Summary of 2022,” 66 units closed (down 12%), 14 units were on the market at the end of 2022 and 4 units “did not sell” (+300% – red). The units are roughly selling at 5.5/month (down 13%) and there are 2.5 months of inventory on the market (up 32%). Odds of selling are down 6 points, to 79%.
6 months of supply is considered a balanced market and less than 6 months is considered a seller’s market. In summary, we see a 12% contraction in closing volume, 32% increase in months supply and a 13% decrease in sales velocity in Hawaii Kai Highrises.
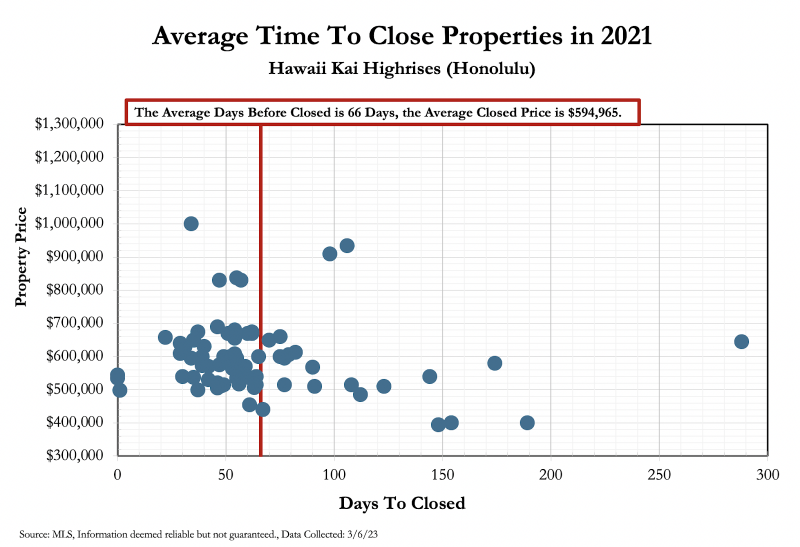
In the past two years, it has taken an average of about 65 days to close a Hawaii Kai Highrise unit for an average sales price of $595k (2021) to $700k (2022).
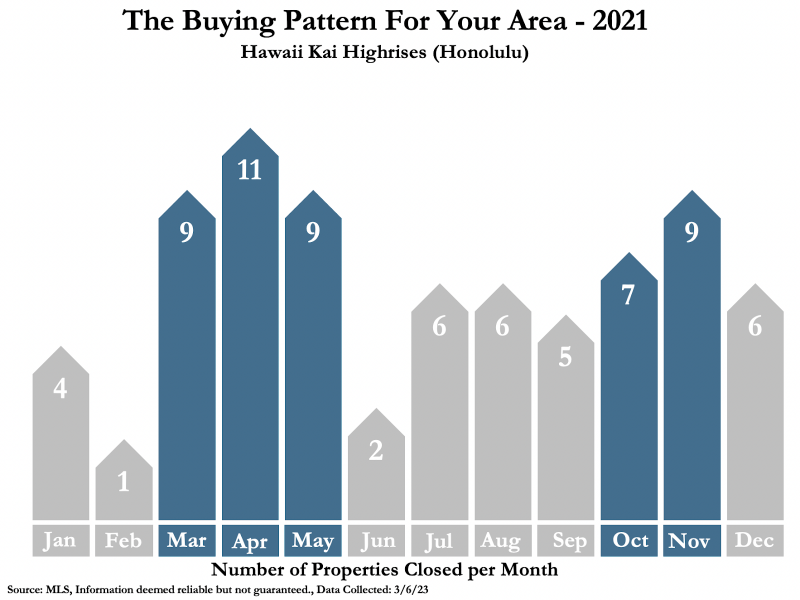
The Buying Patterns chart shows how the closings are dispersed throughout the year. In 2021, we can see a bunching of closings from Mar-May and then Oct-Nov. This is atypical for property, which usually trades predominantly in the Spring & Summer selling season. The 4th quarter, typically only sees 10% of annual sales, because families are distracted by holiday gatherings and travel. With Covid, real estate activity roared right through 4th quarter.
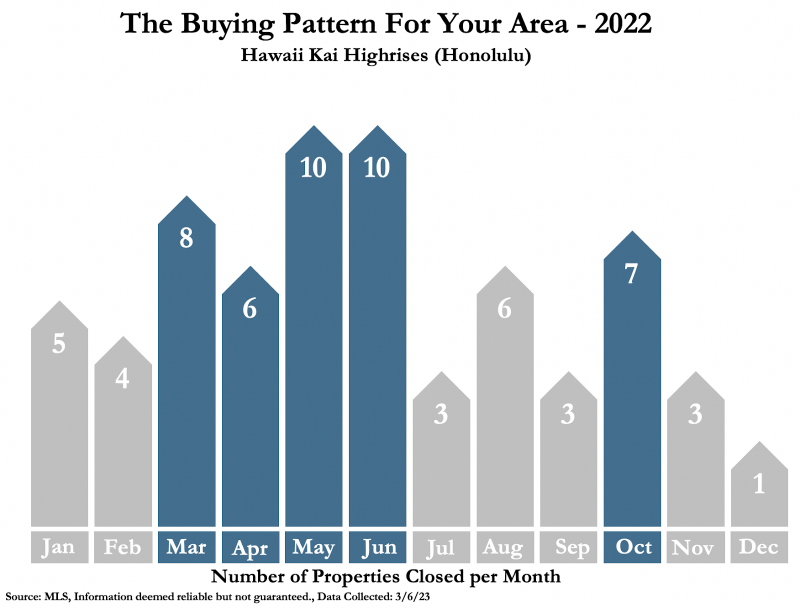
We can see a return to a more typical selling pattern in 2022, with dissipating Covid worries.
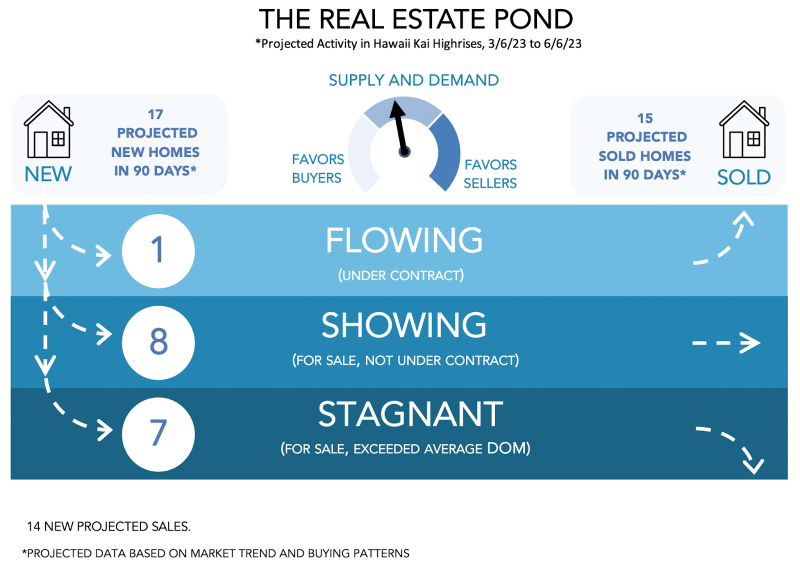
The Pond Chart takes the last 2 years of data and projects what the next 90 days will look like. Given these numbers, it is projected that in the next 90 days, there will likely be 17 new Hawaii Kai Highrise units added to the market for sale and 15 closings will occur.
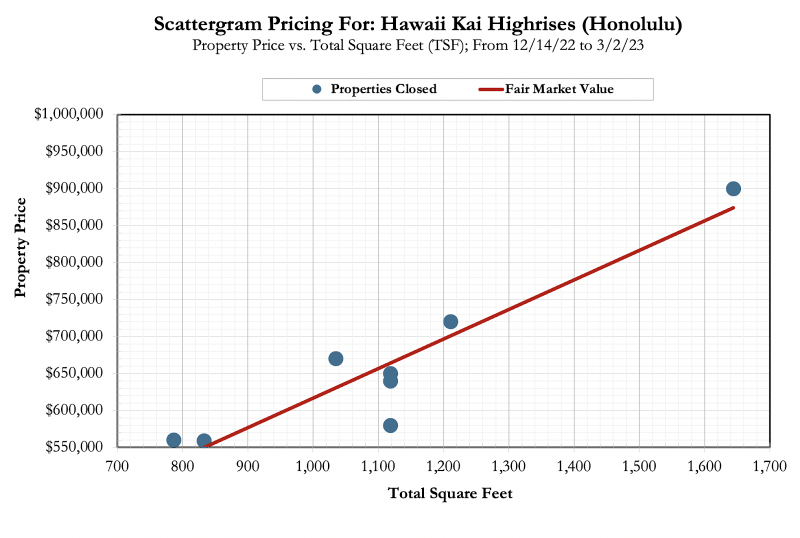
This chart tries to demonstrate the relationship between square footage and price. Each dot represents a closing since 12/14/2022. A 1640 SF unit falls in the upper $800,000 range.
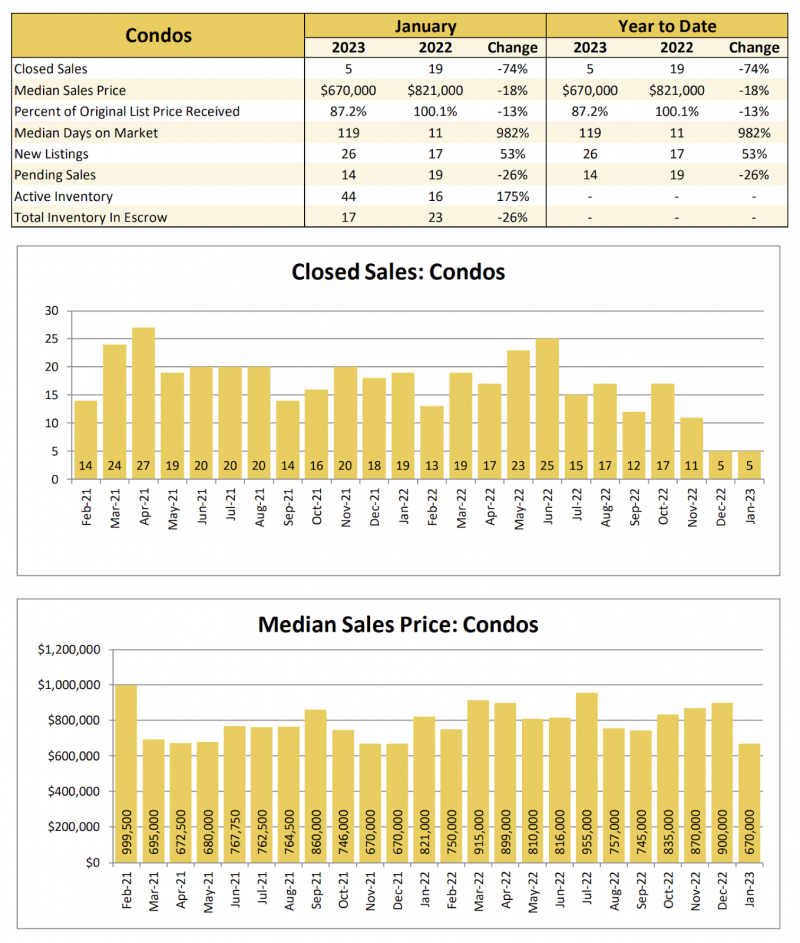
In January, closed sales in Hawaii Kai condos were down 74%. Median Sales Price is down 18%. Percent of original list price received down by 13%. Median Days on Market are up 982%. New Listings have increased 53% and Pending Sales are down 25%. The most notable change in declining sales for condos island-wide, is the price range between $800k to $2M price range, is down 60% year-over-year

Leave your opinion here. Please be nice. Your Email address will be kept private, this form is secure and we never spam you.