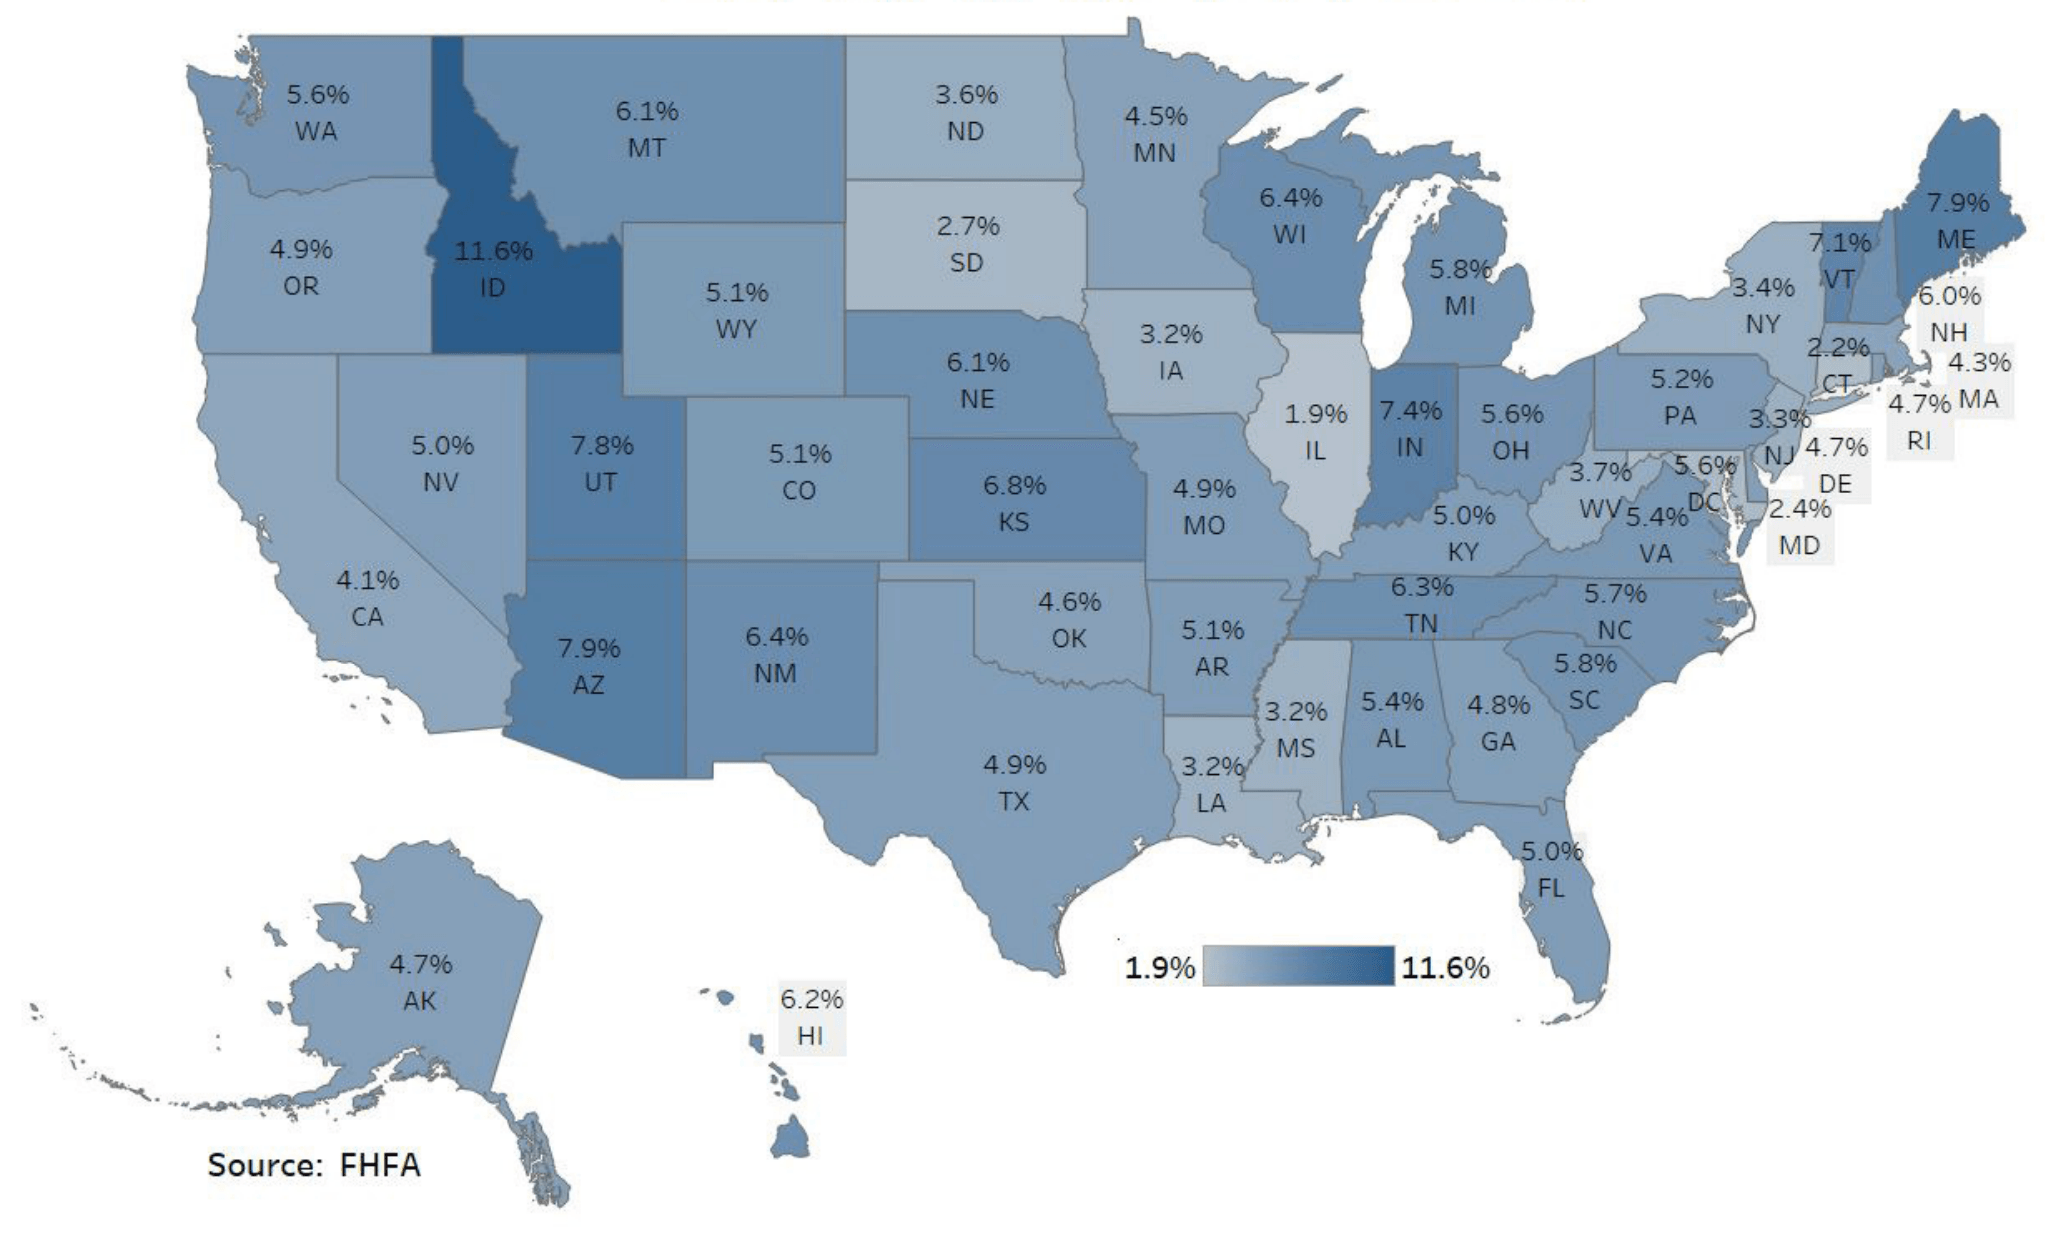
If we look at the big picture, the nation’s prices were up ~5%, year over year, through the third quarter, 2019. Hawaii, as a state, was 11th in the nation for price appreciation. Up ~6% (Source FHFA.gov).
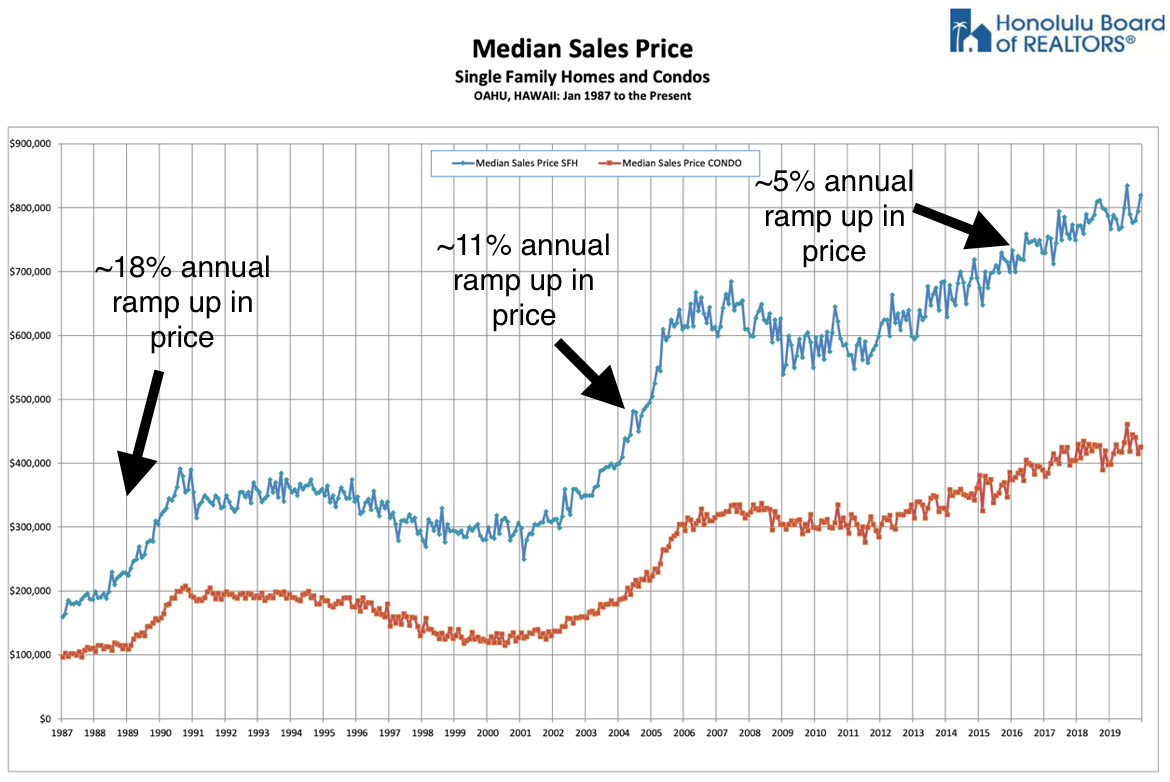
This chart shows us Oahu‘s change in median sales price since 1987. We can see a run up from ’87-90, where there were bursts of ~18% annual price gains. In the 2nd run up, of ’01-06, we can also see double-digit annual price gains, this time around 11%. In this current run up from 2011/2012, the gains are much more tempered at ~5%. These gains are over 1/3 and half of the two previous cycle’s double-digit, “bubblicious” gains. Could we be seeing a “Goldilocks expansion” that is “not too hot, or not too cold, but just right?” In that scenario, we could be experiencing a 20+ year expansion, like Australia. Or is a recession around the corner? According to Ken Miller, CIO of First Hawaiian Bank, he “doesn’t predict a recession in the next 12-18 months.
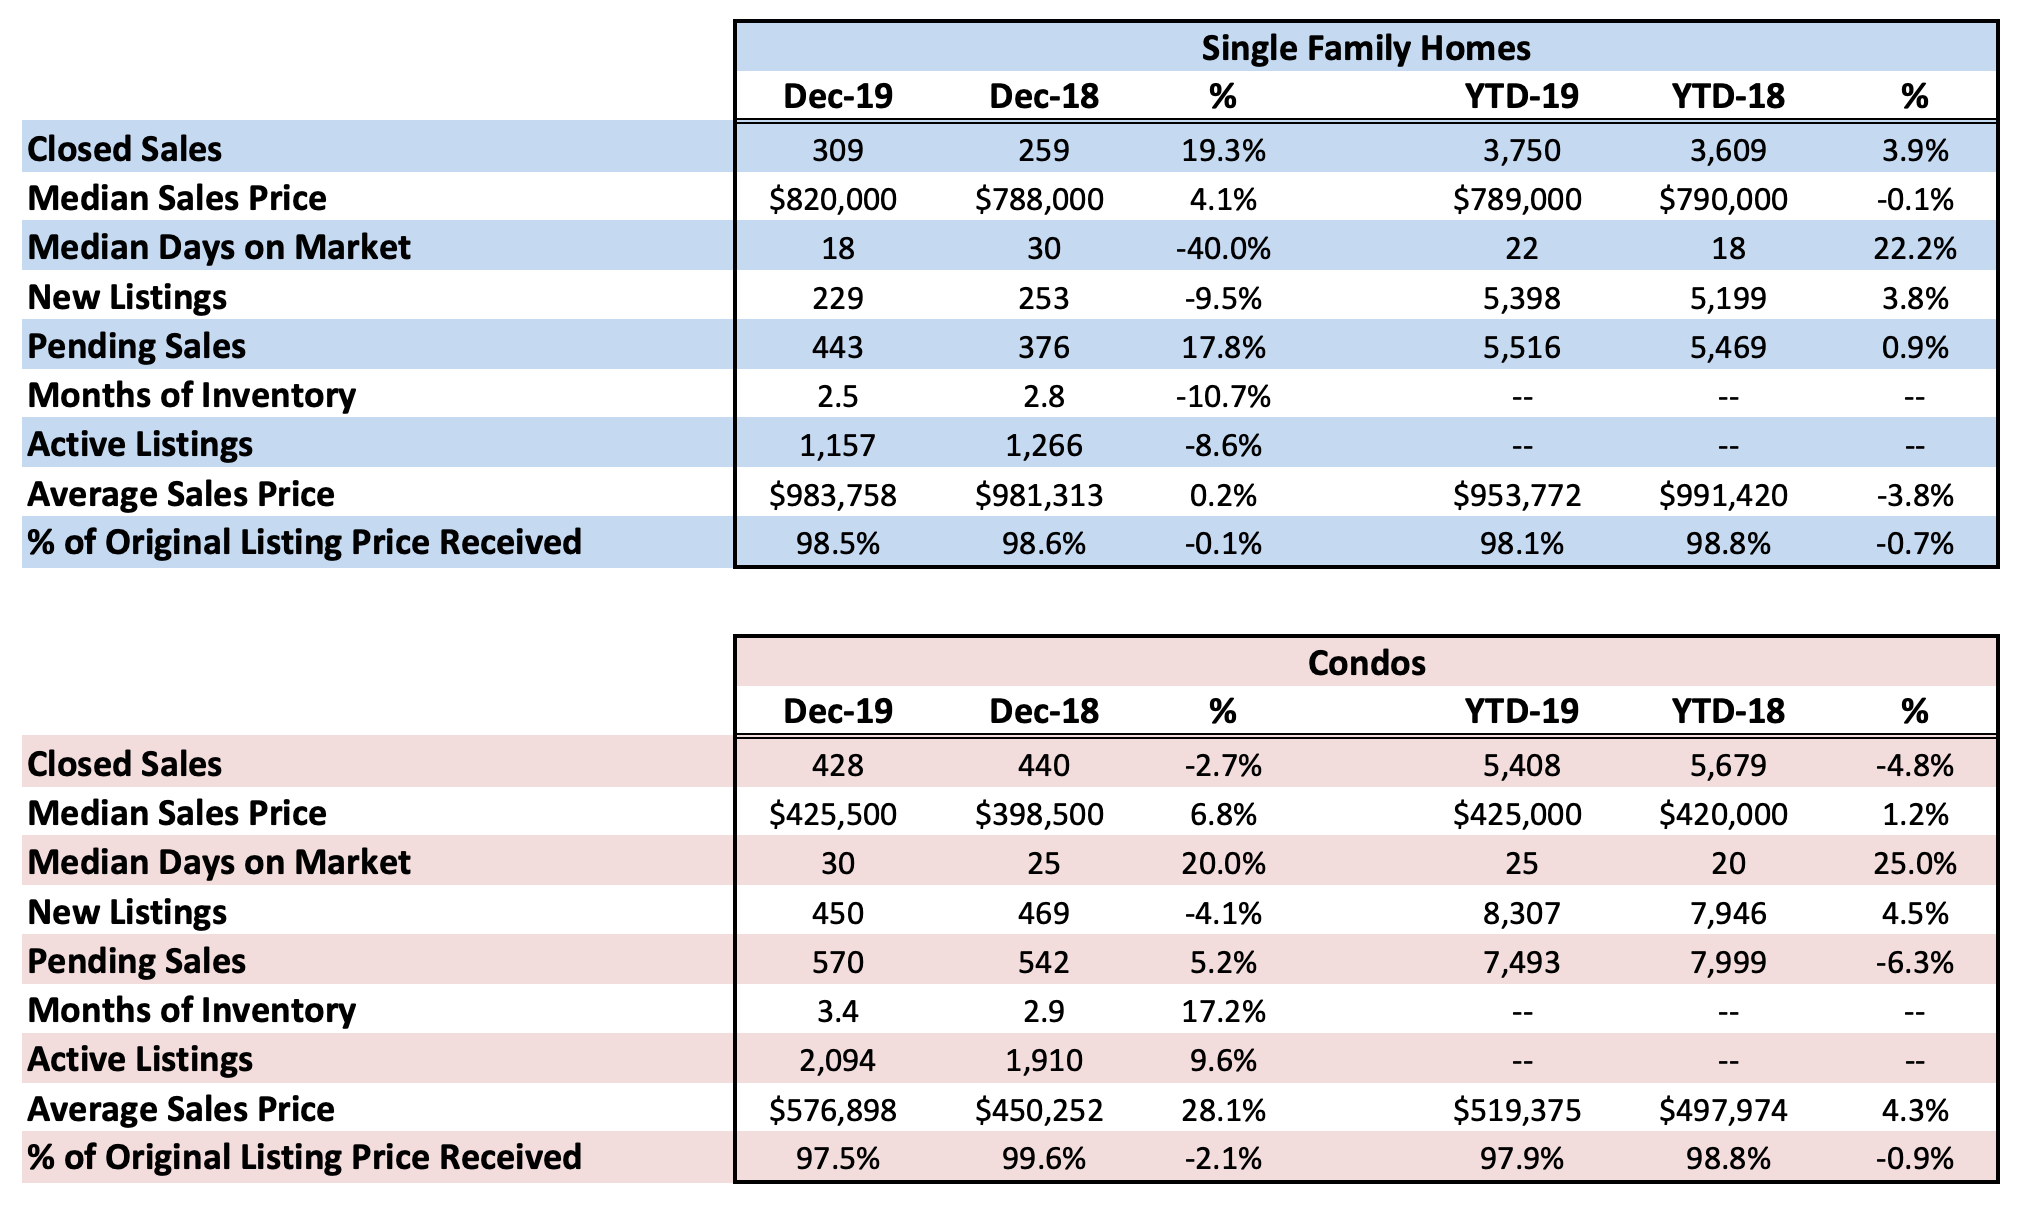
Looking closer at Oahu’s median price for 2019, single family home and condo, were essentially unchanged/flat, year over year, at $789,000 & $425,000, respectively (Source Honolulu Board of Realtors).
What would cause 2019 prices to be flat on Oahu? Potentially, the answer could be 1) increased supply, 2) decreased demand, and a 3) slowing economy.
1. Increased Supply
This chart shows an increase in supply has been occurring. However, you can see it dropping off from the summer of 2019 towards the end of 2019 (Source Honolulu Board of Realtors).
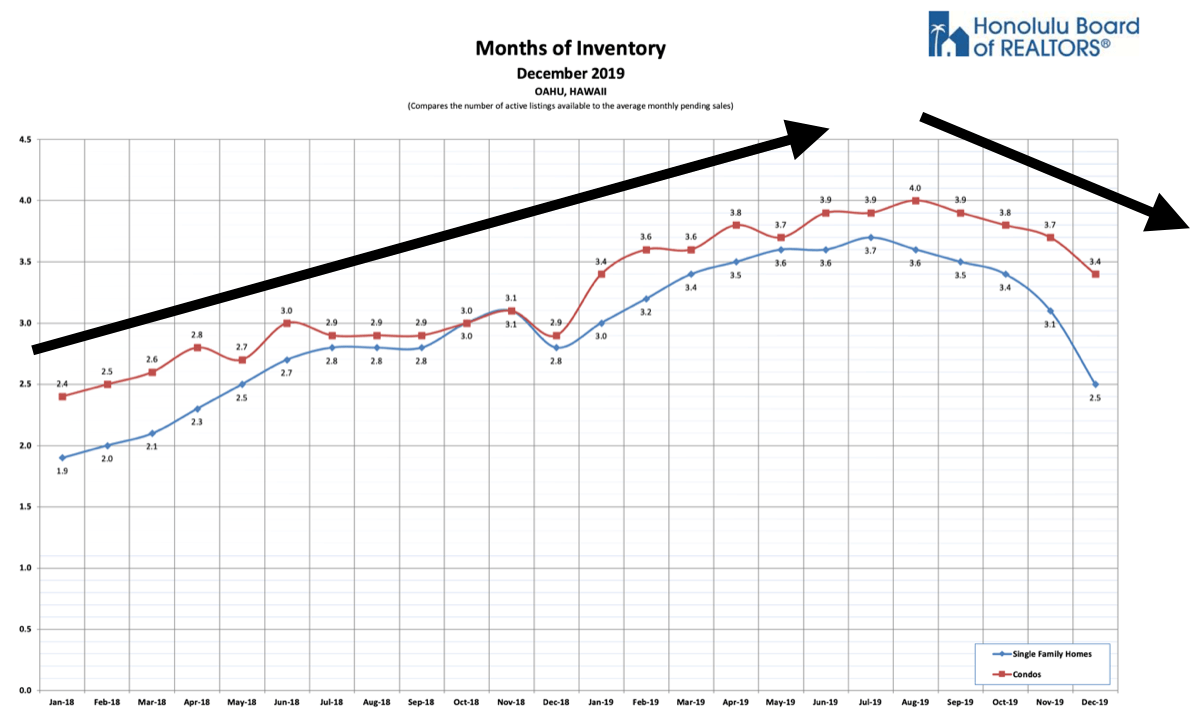
This chart from December, also confirms the supply indicators have been turning back down slightly, after steady gains since 2017. 6 months is considered a balanced market. Less than 6 is a seller’s market (<6 months,) and anything greater than that is a buyer’s market (>6 months). We are currently hovering around 3 months.
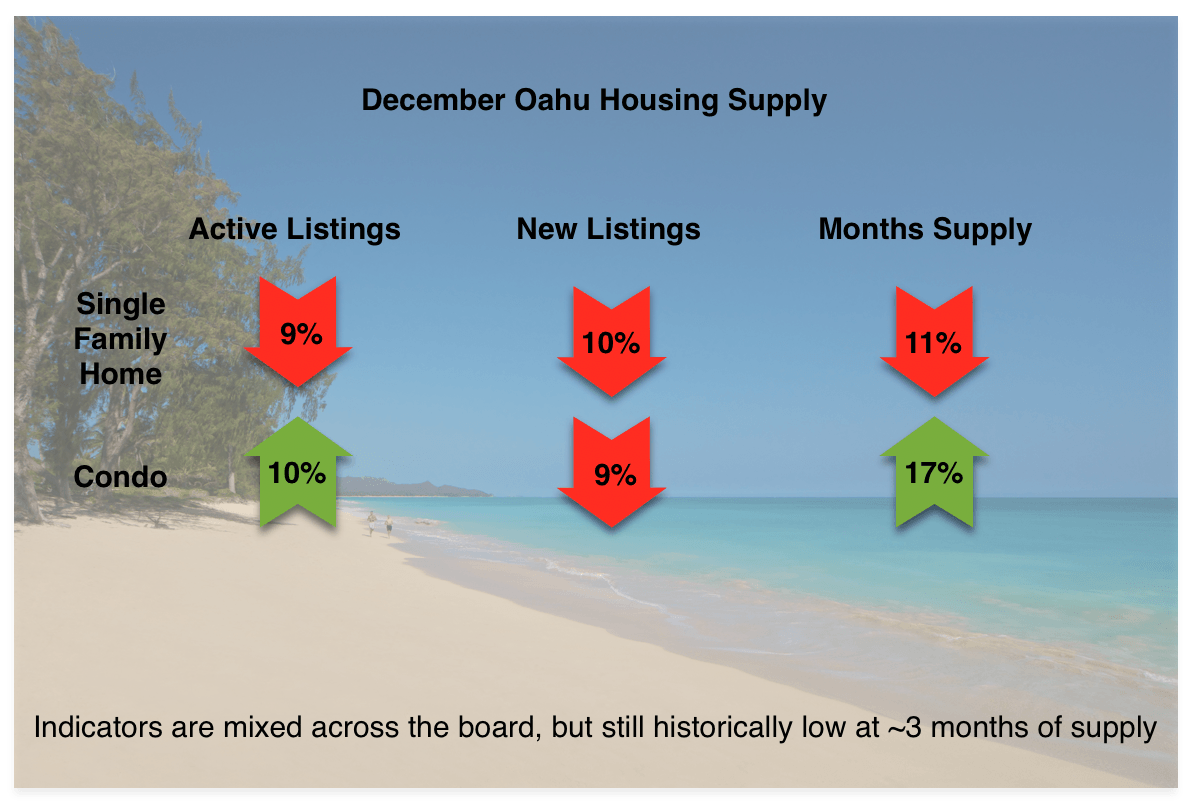
So we can definitely see supply has been increasing since 2017, but the end of 2019 might be the start further tightening…
2. Decreased Demand
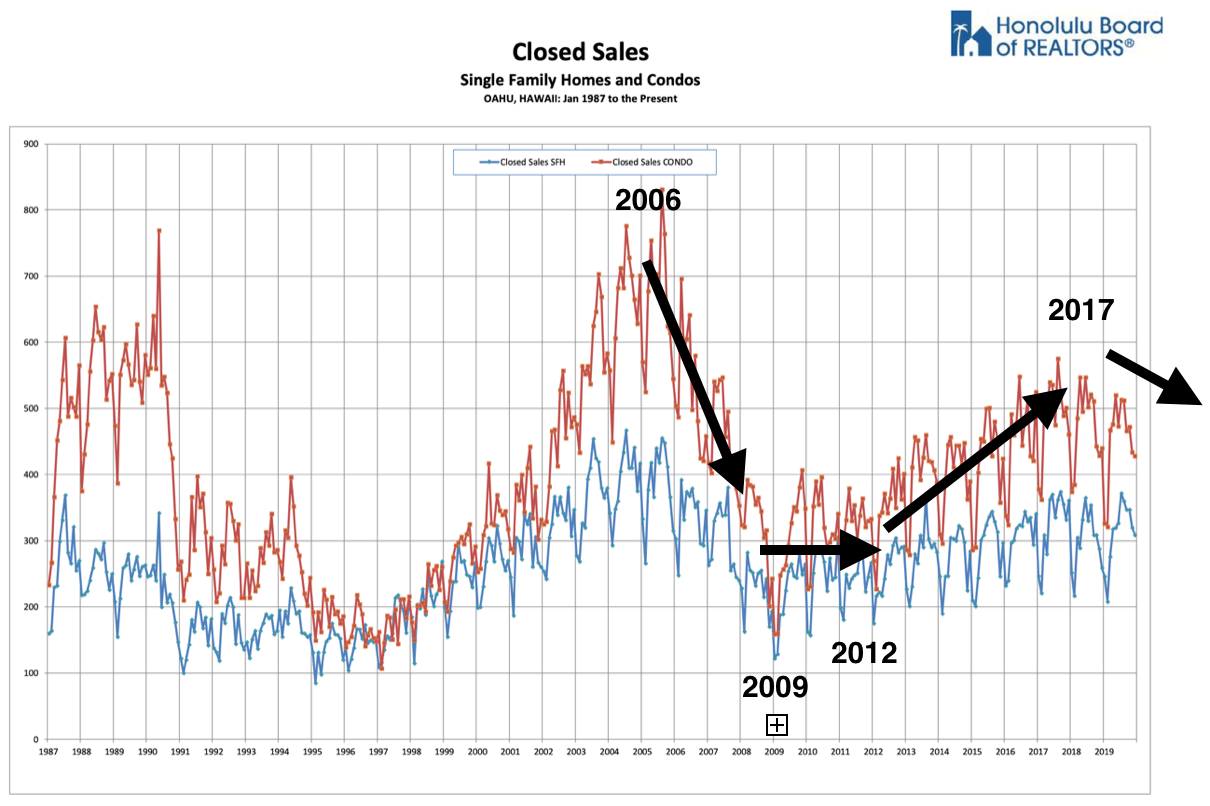
In this chart, we can see closed sales over time (demand). From the peak of the market in 2006, demand decreased for 3 years during the great recession. In 2009, demand bottomed for about two/three years and then started to turn up in 2011/12. Mid 2017, demand peaked, and we can see over the last several years a downward trend.
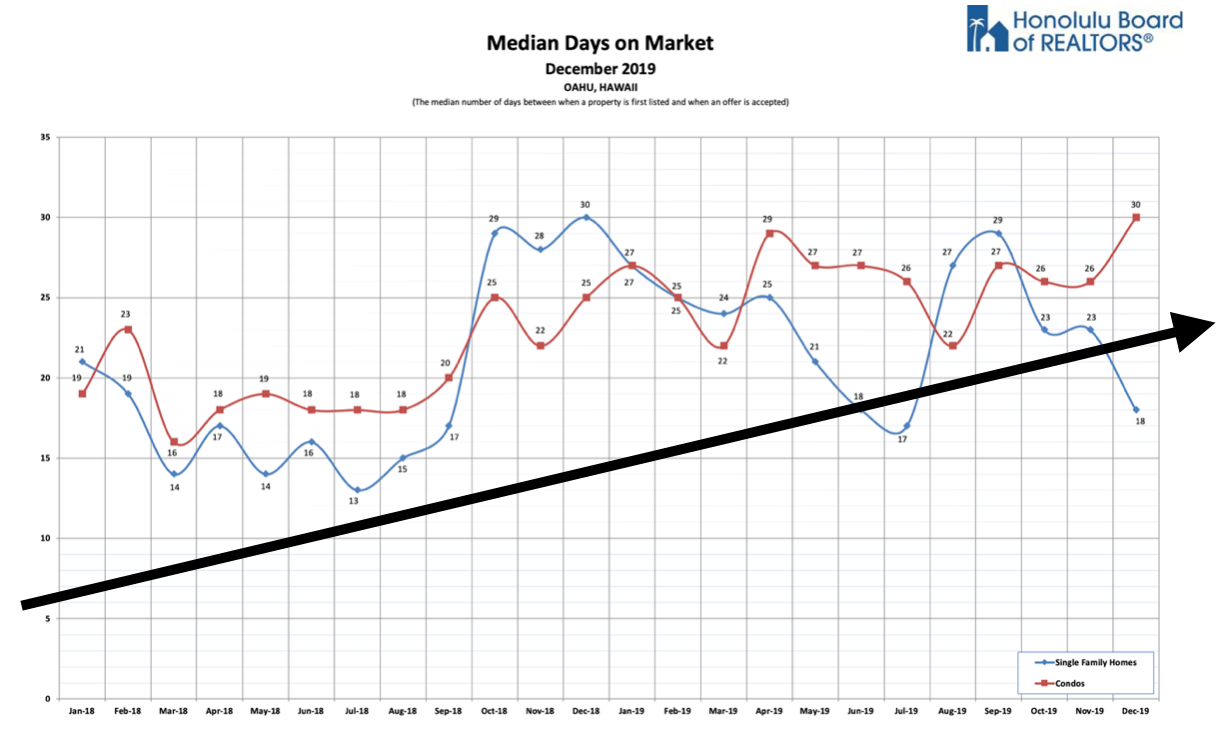
The length of time it takes to sell property, or days on market, is a reflection of buyer’s demand. From 2018 thru 2019, DOM has been creeping up from nearly 3 weeks to sell property to almost a month (Source Honolulu Board of Realtors).
In this next chart, we can see double-digit growth in Days on Market, at just about every price point. The breaking point for single family homes occurs at about $1.9M. Homes below $1.9M sell in ~3 weeks, but above that, it could take over a month. The breaking point for condominiums occurs at about $700,000 (Source Honolulu Board of Realtors).
3. Slowing Economy
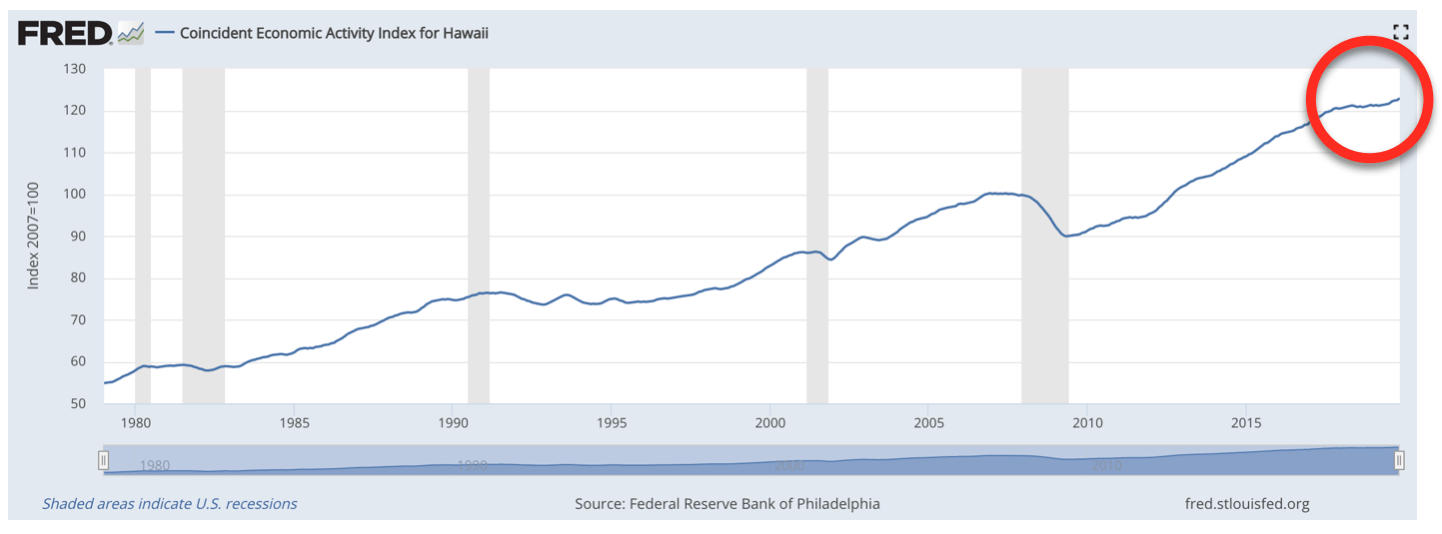
This chart shows us Hawaii’s Economic Activity. We can see a pretty steady upward climb from the Spring of 2010. The economic activity went flat from summer 2017 to about the summer of 2019, and then we can see the activity regain, what appears to be, an upward trajectory (Source Federal Reserve Bank of Philadelphia).
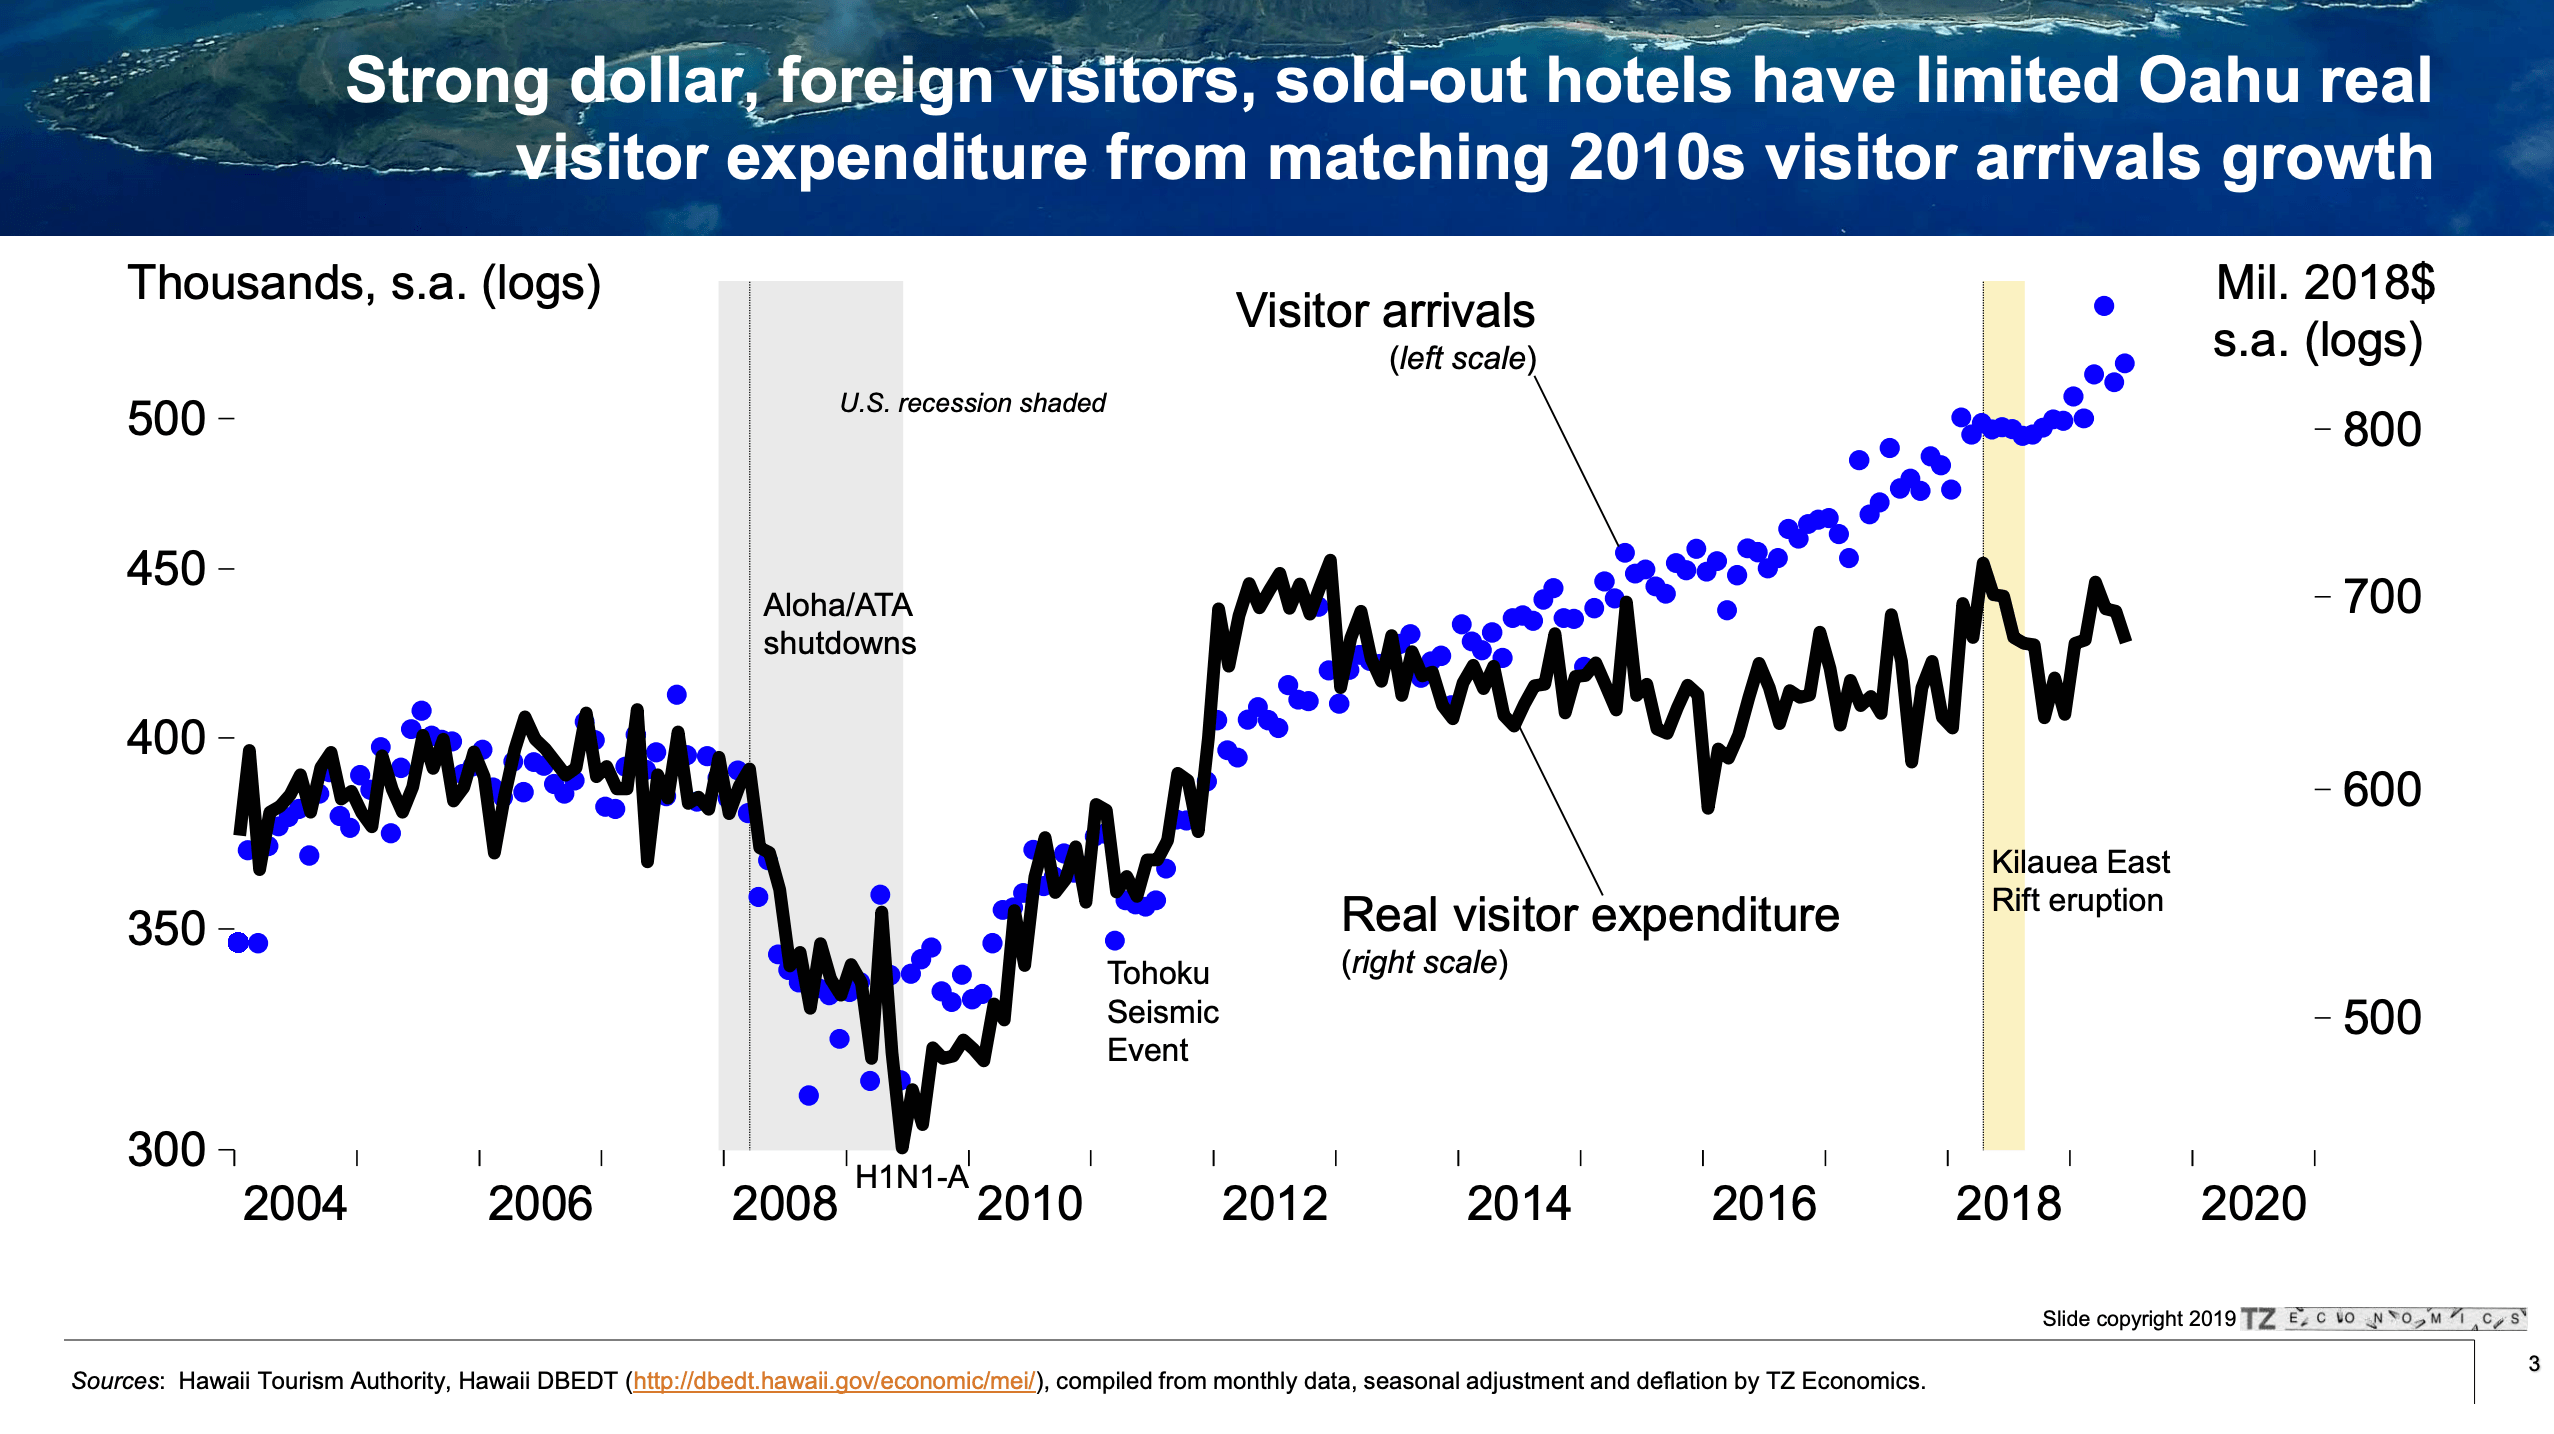
This chart shows us tourism data for Hawaii through November 2019. Tourism is the 2nd largest industry in Hawaii, after the military. We can see 4 of the 6 data sets, from visitor expenditures to visitor length of stay, are down or flat. This is representative of the flat Economic Activity observed in the previous chart. Hopefully, December and January’s reports from DBEDT will reflect a slight up turn, similar to the Economic Activity Index (Source DBEDT, Hawaii).
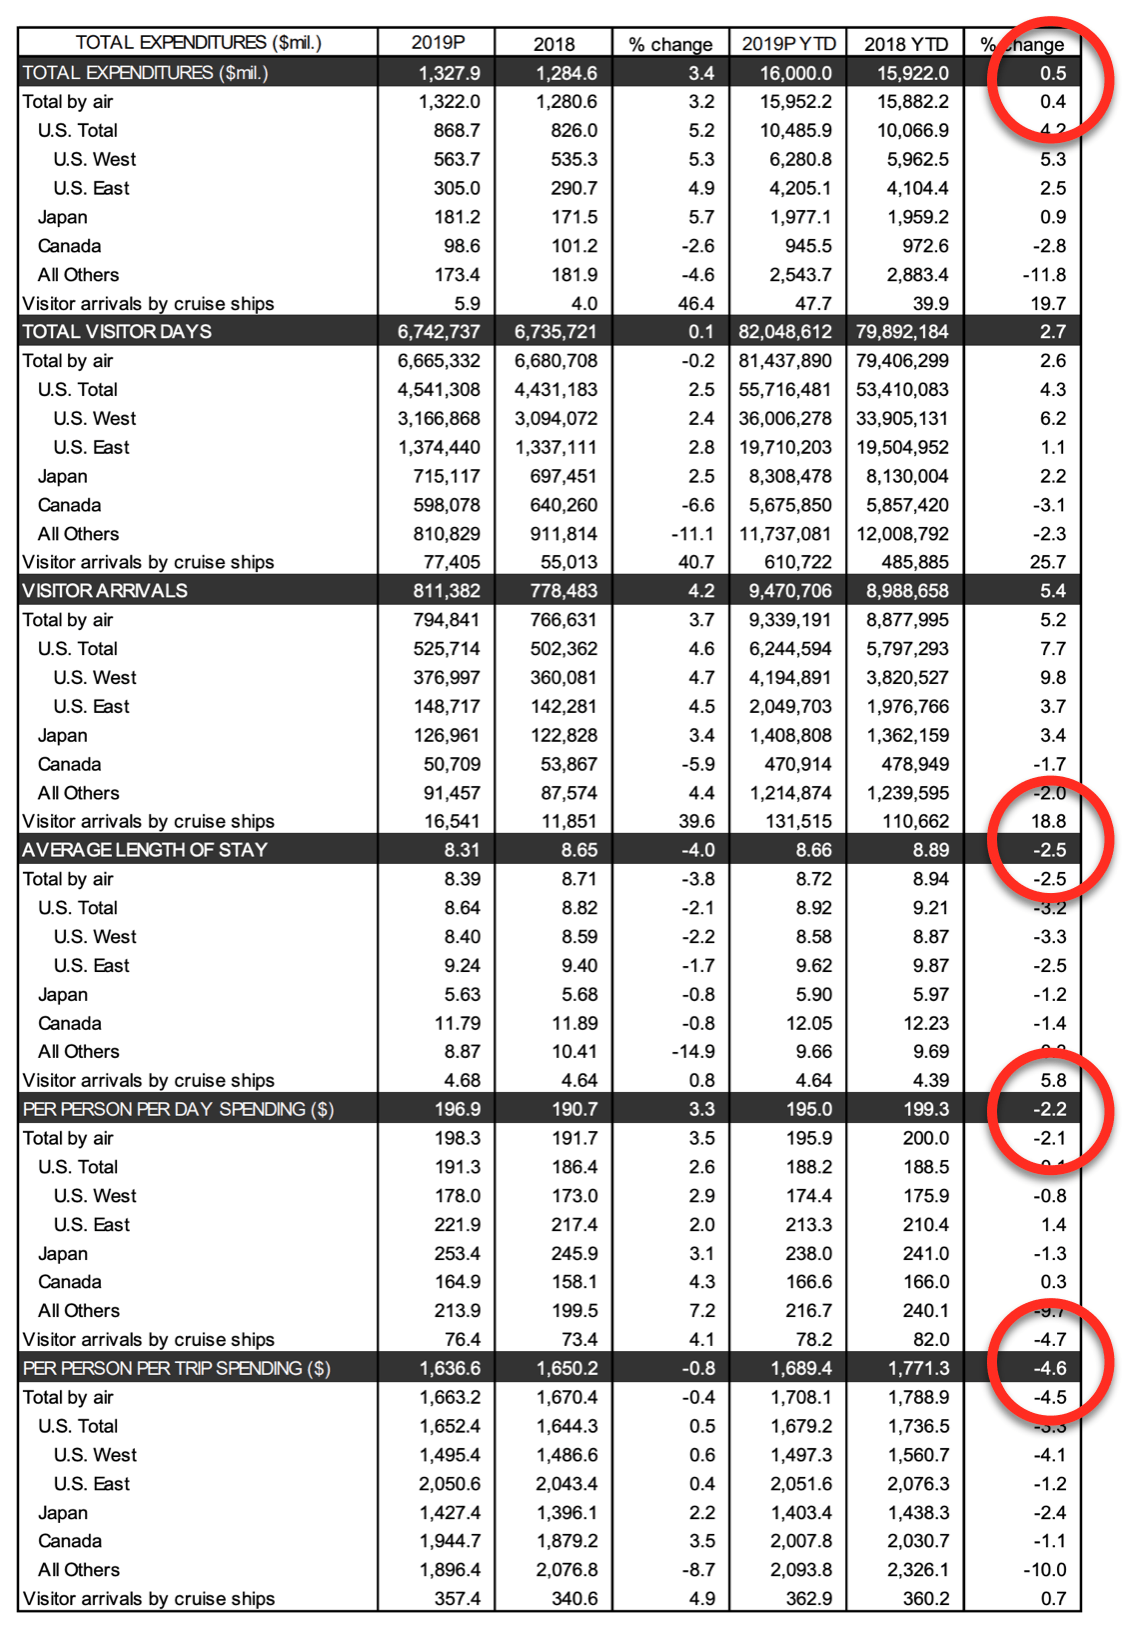
The only two data sets that are up are visitor arrivals and visitor days. This represents Hawaii’s “overtourism” issue. Since 1989, our visitor expenditures have plateaued and stagnated, at about $18 billion/yr. However, visitors to the state, over the past 30 years, have increased by 4 million/year. This “overtourism” effect, has increased traffic congestion and heightened stresses to Hawaii’s infrastructure and natural resources. These negative effects come without any added benefit or monetary gain in return to the state and its people (Source Paul Brewbaker – TMZ Economics).
In summary, there was definitely a slow down in activity in 2018. Since 2017, supply has increased, and demand(closing) has decreased, causing prices to flatten and days on market to stretch out. Economic activity slowed in Hawaii for 2018, but might be showing signs of rejuvenating. Stayed tuned.
Aloha,
Jake Vaughan, RA, MBA

Leave your opinion here. Please be nice. Your Email address will be kept private, this form is secure and we never spam you.