From Q1 to Q2: The Market Shifts Every Big Island Buyer and Seller Should Know
Last month, Hawai‘i Life released its Q2 market report, and as we suspected, it confirms that our Big Island real estate market has eased into a slower, more measured pace. Inventory has expanded significantly, giving buyers more options. At the same time, median sold prices in both the residential and luxury markets remain higher than last year—a sign that well-positioned properties are still commanding strong values.
But when you compare Q2 to Q1 this year, the story gets even more interesting.
Report Highlights (Residential Market)
Current inventory is up 22.7% YoY.
Sold listings are down 1.5% YoY.
The median sold price is up 9.1% YoY.
The price per square foot is down 1.5% YoY.
Download a full copy of the report here.
Residential 3m+ Luxury Market Overview

“$3M+ segment sees price growth amid measured pace.
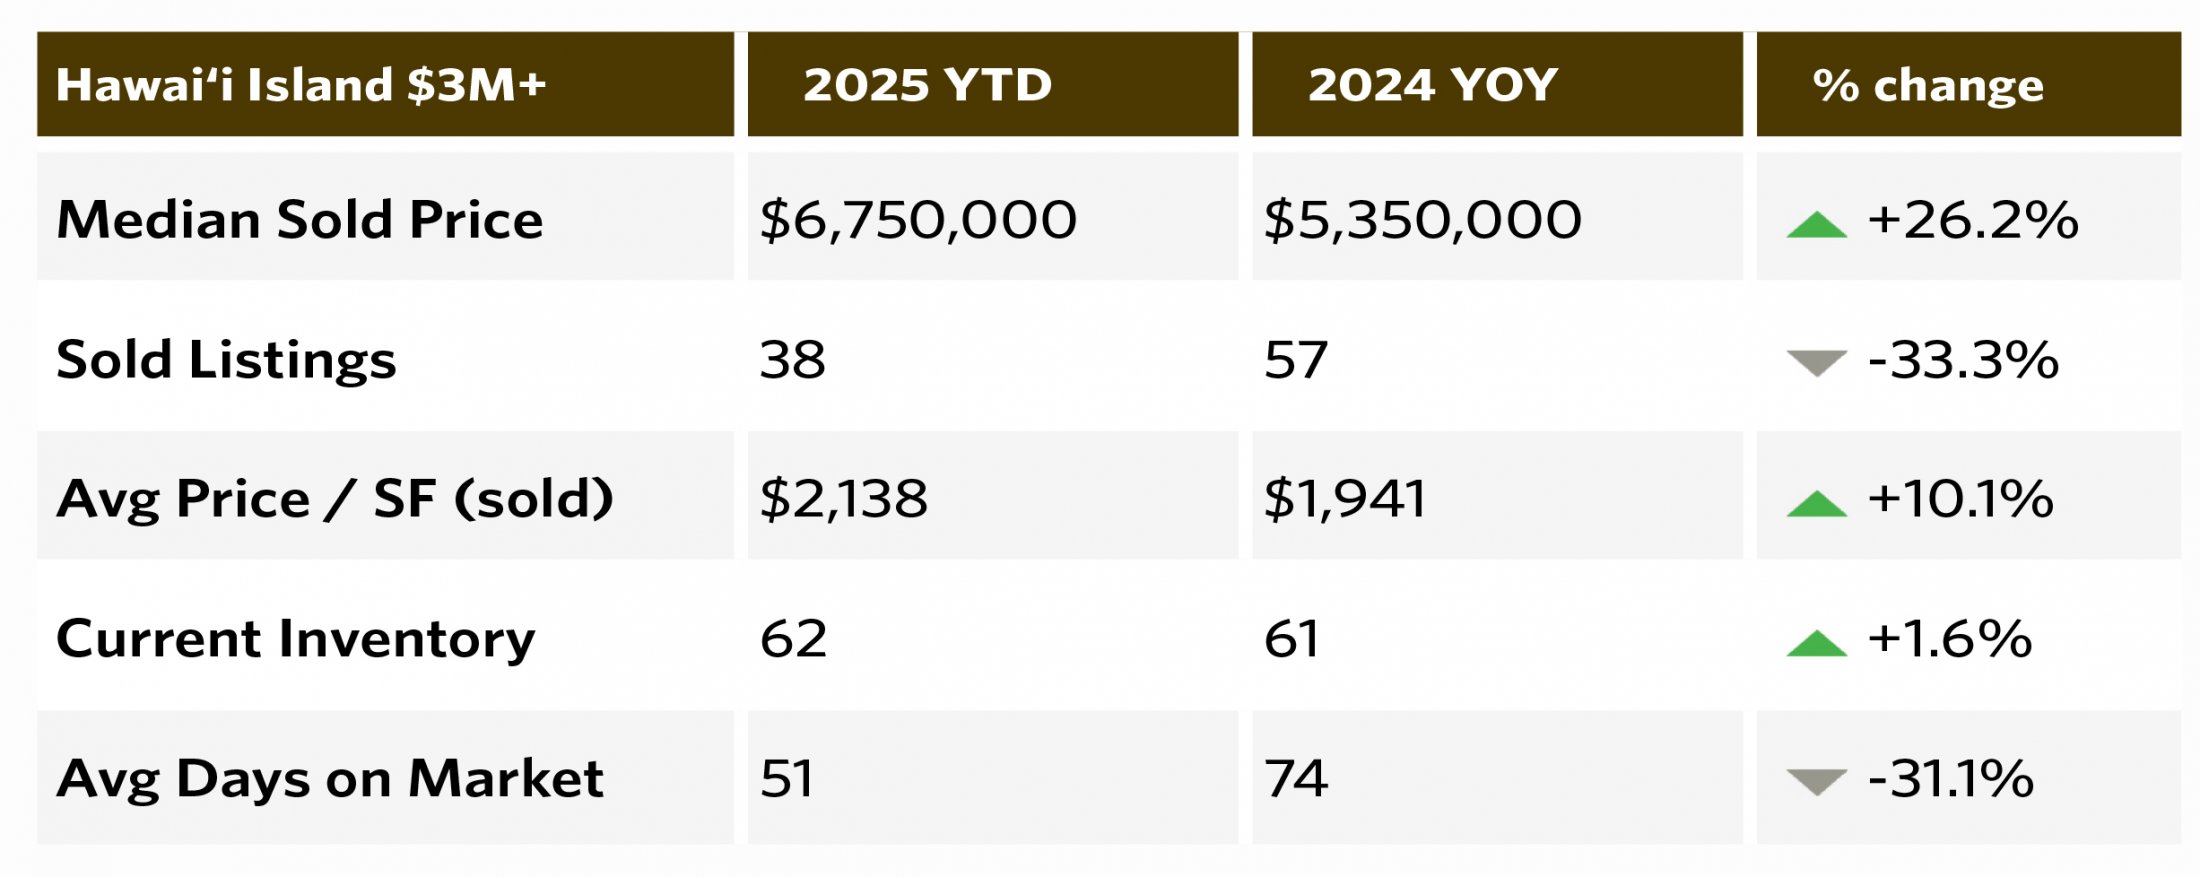
In the first half of 2025, Hawai‘i Island recorded 38 closed sales in the $3M+ market, down from 57 during the same period last year. Median sold price rose 26.2% to $6.75M, while DOM shortened by more than three weeks. Though fewer transactions took place, higher price points and faster closings suggest that well-positioned listings continue to attract motivated luxury buyers.”
Luxury Market ($3M+): Prices Up, Sales Down YoY, but not Q1 to Q2
- Q1 2025: 23 sold listings in the $3M+ segment, with pricing already showing strong upward momentum YoY.
- Median Sold Price $7,250,000, Avg Price/SF (Sold) – $2100, Inventory – 73, Avg DOM – 54
- Q2 2025 (YTD): 38 sold listings compared to 57 at this point last year. Median sold price jumped 26.2% year-over-year to $6.75M, but transactions dropped by a third YoY.
- Median Sold Price $6,750,000, Avg Price/SF (Sold) – $2138, Inventory – 62, Avg DOM – 51

In other words, while fewer deals are closing than last year, the quarter-over-quarter numbers suggest that luxury sales increased in pace but didn’t quite maintained pricing power. High-quality, well-positioned listings are still attracting motivated buyers, and often selling faster than they did in 2024 and even in Q1 2025. Luxury market inventory was also lower in Q2 than in Q1, indicating a demand for these properties at the right price.
Residential Submarket Snapshot
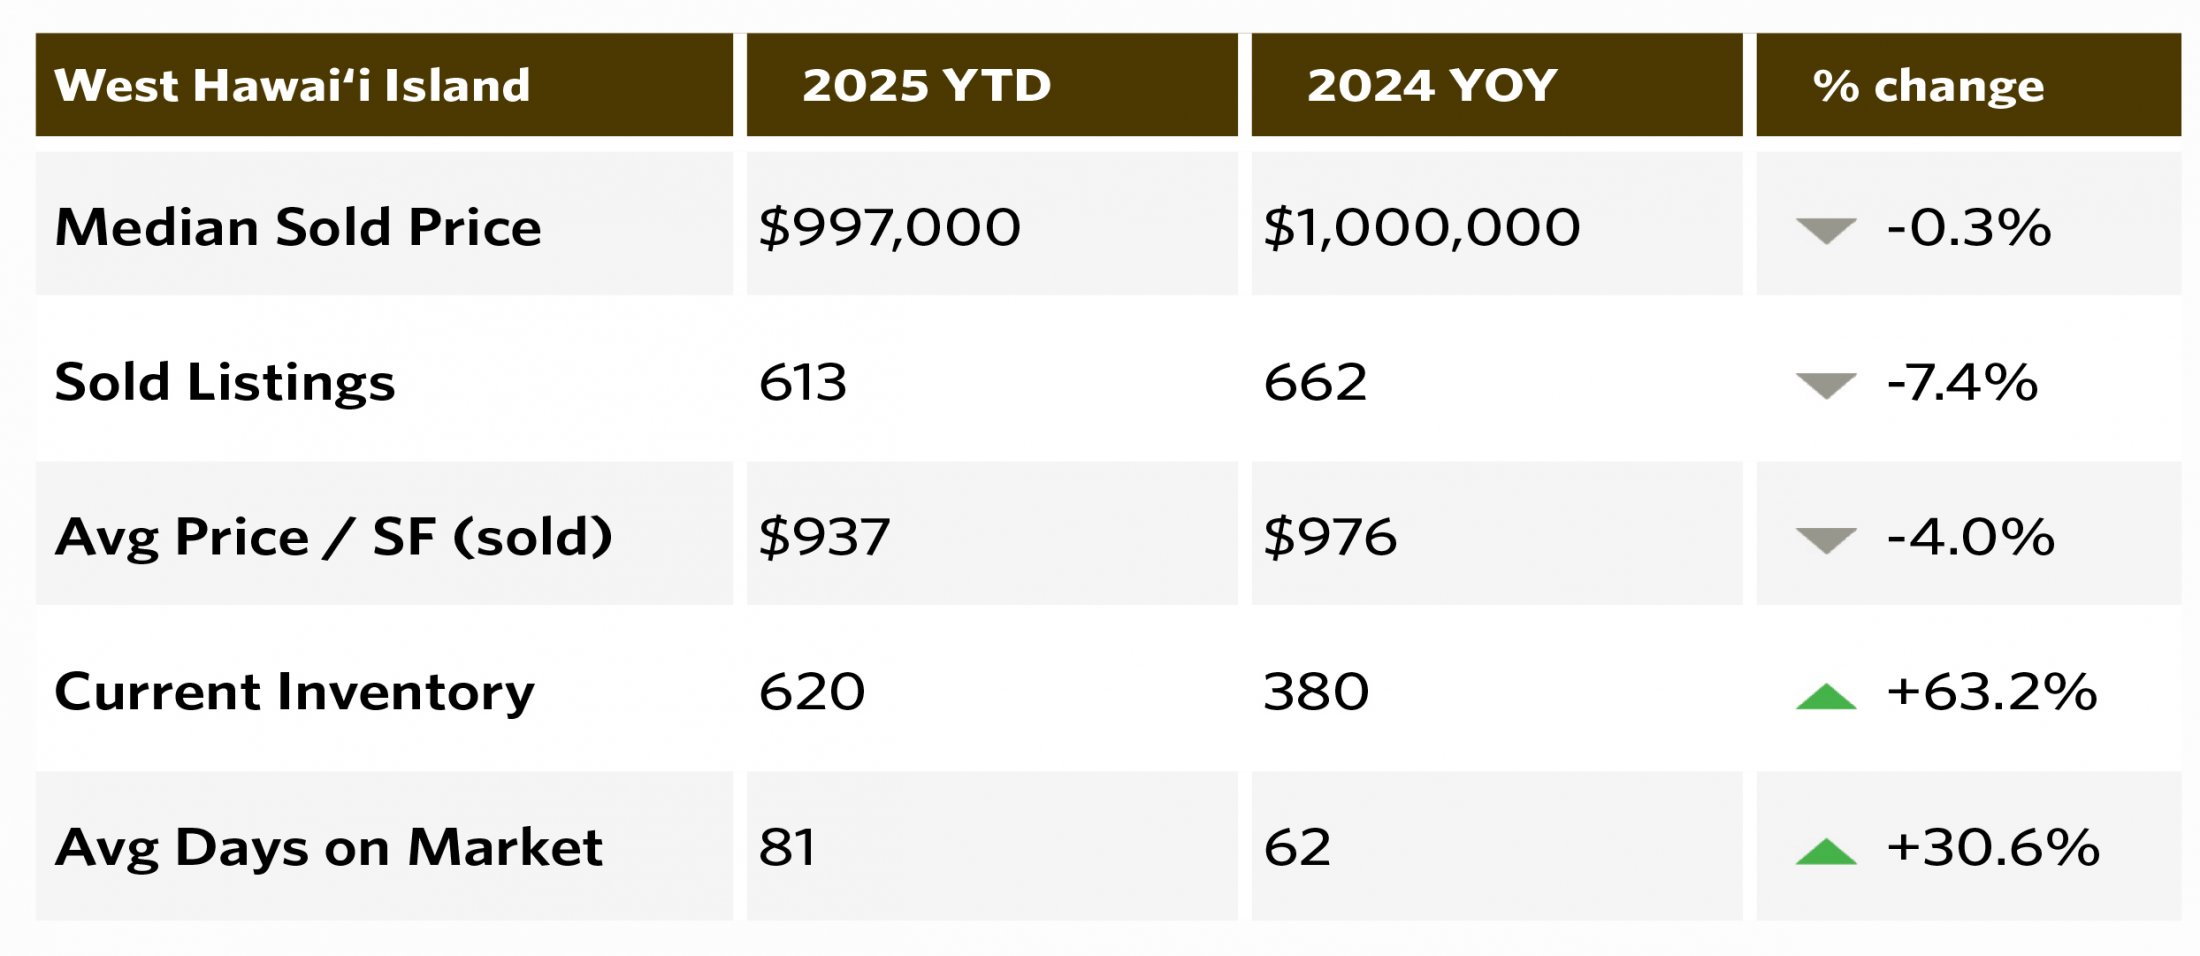
In West Hawai‘i, the residential submarket saw some notable quarter-to-quarter shifts. Median sold price dropped from $1.245M in Q1 to $997K in Q2 (YTD), a sizable decrease that suggests more mid-range properties are selling, bringing down the overall median.
While sold listings jumped from 196 in Q1 to 613 Q2, year-over-year sales in this submarket are still down, showing that Q2 activity couldn’t fully offset slower momentum earlier in the year. Average price per square foot dipped from $986 to $937, and days on market inched up from 78 to 81. Perhaps the most dramatic change is inventory, which more than doubled from 292 in Q1 to 620 in Q2, giving buyers far more options and putting additional pressure on sellers to price competitively. Very telling.

Residential Market Snapshot
“On Hawai‘i Island, thoughtful demand and growing inventory are creating a more measured market pace.”
“Inventory is up and median sold price grew 9.1% to $585,000 in the first half of 2025. Buyers are more measured, with interest rates and broader economic factors playing a role as the market finds a more balanced pace.”
Residential Market Overview
Median Sold Price
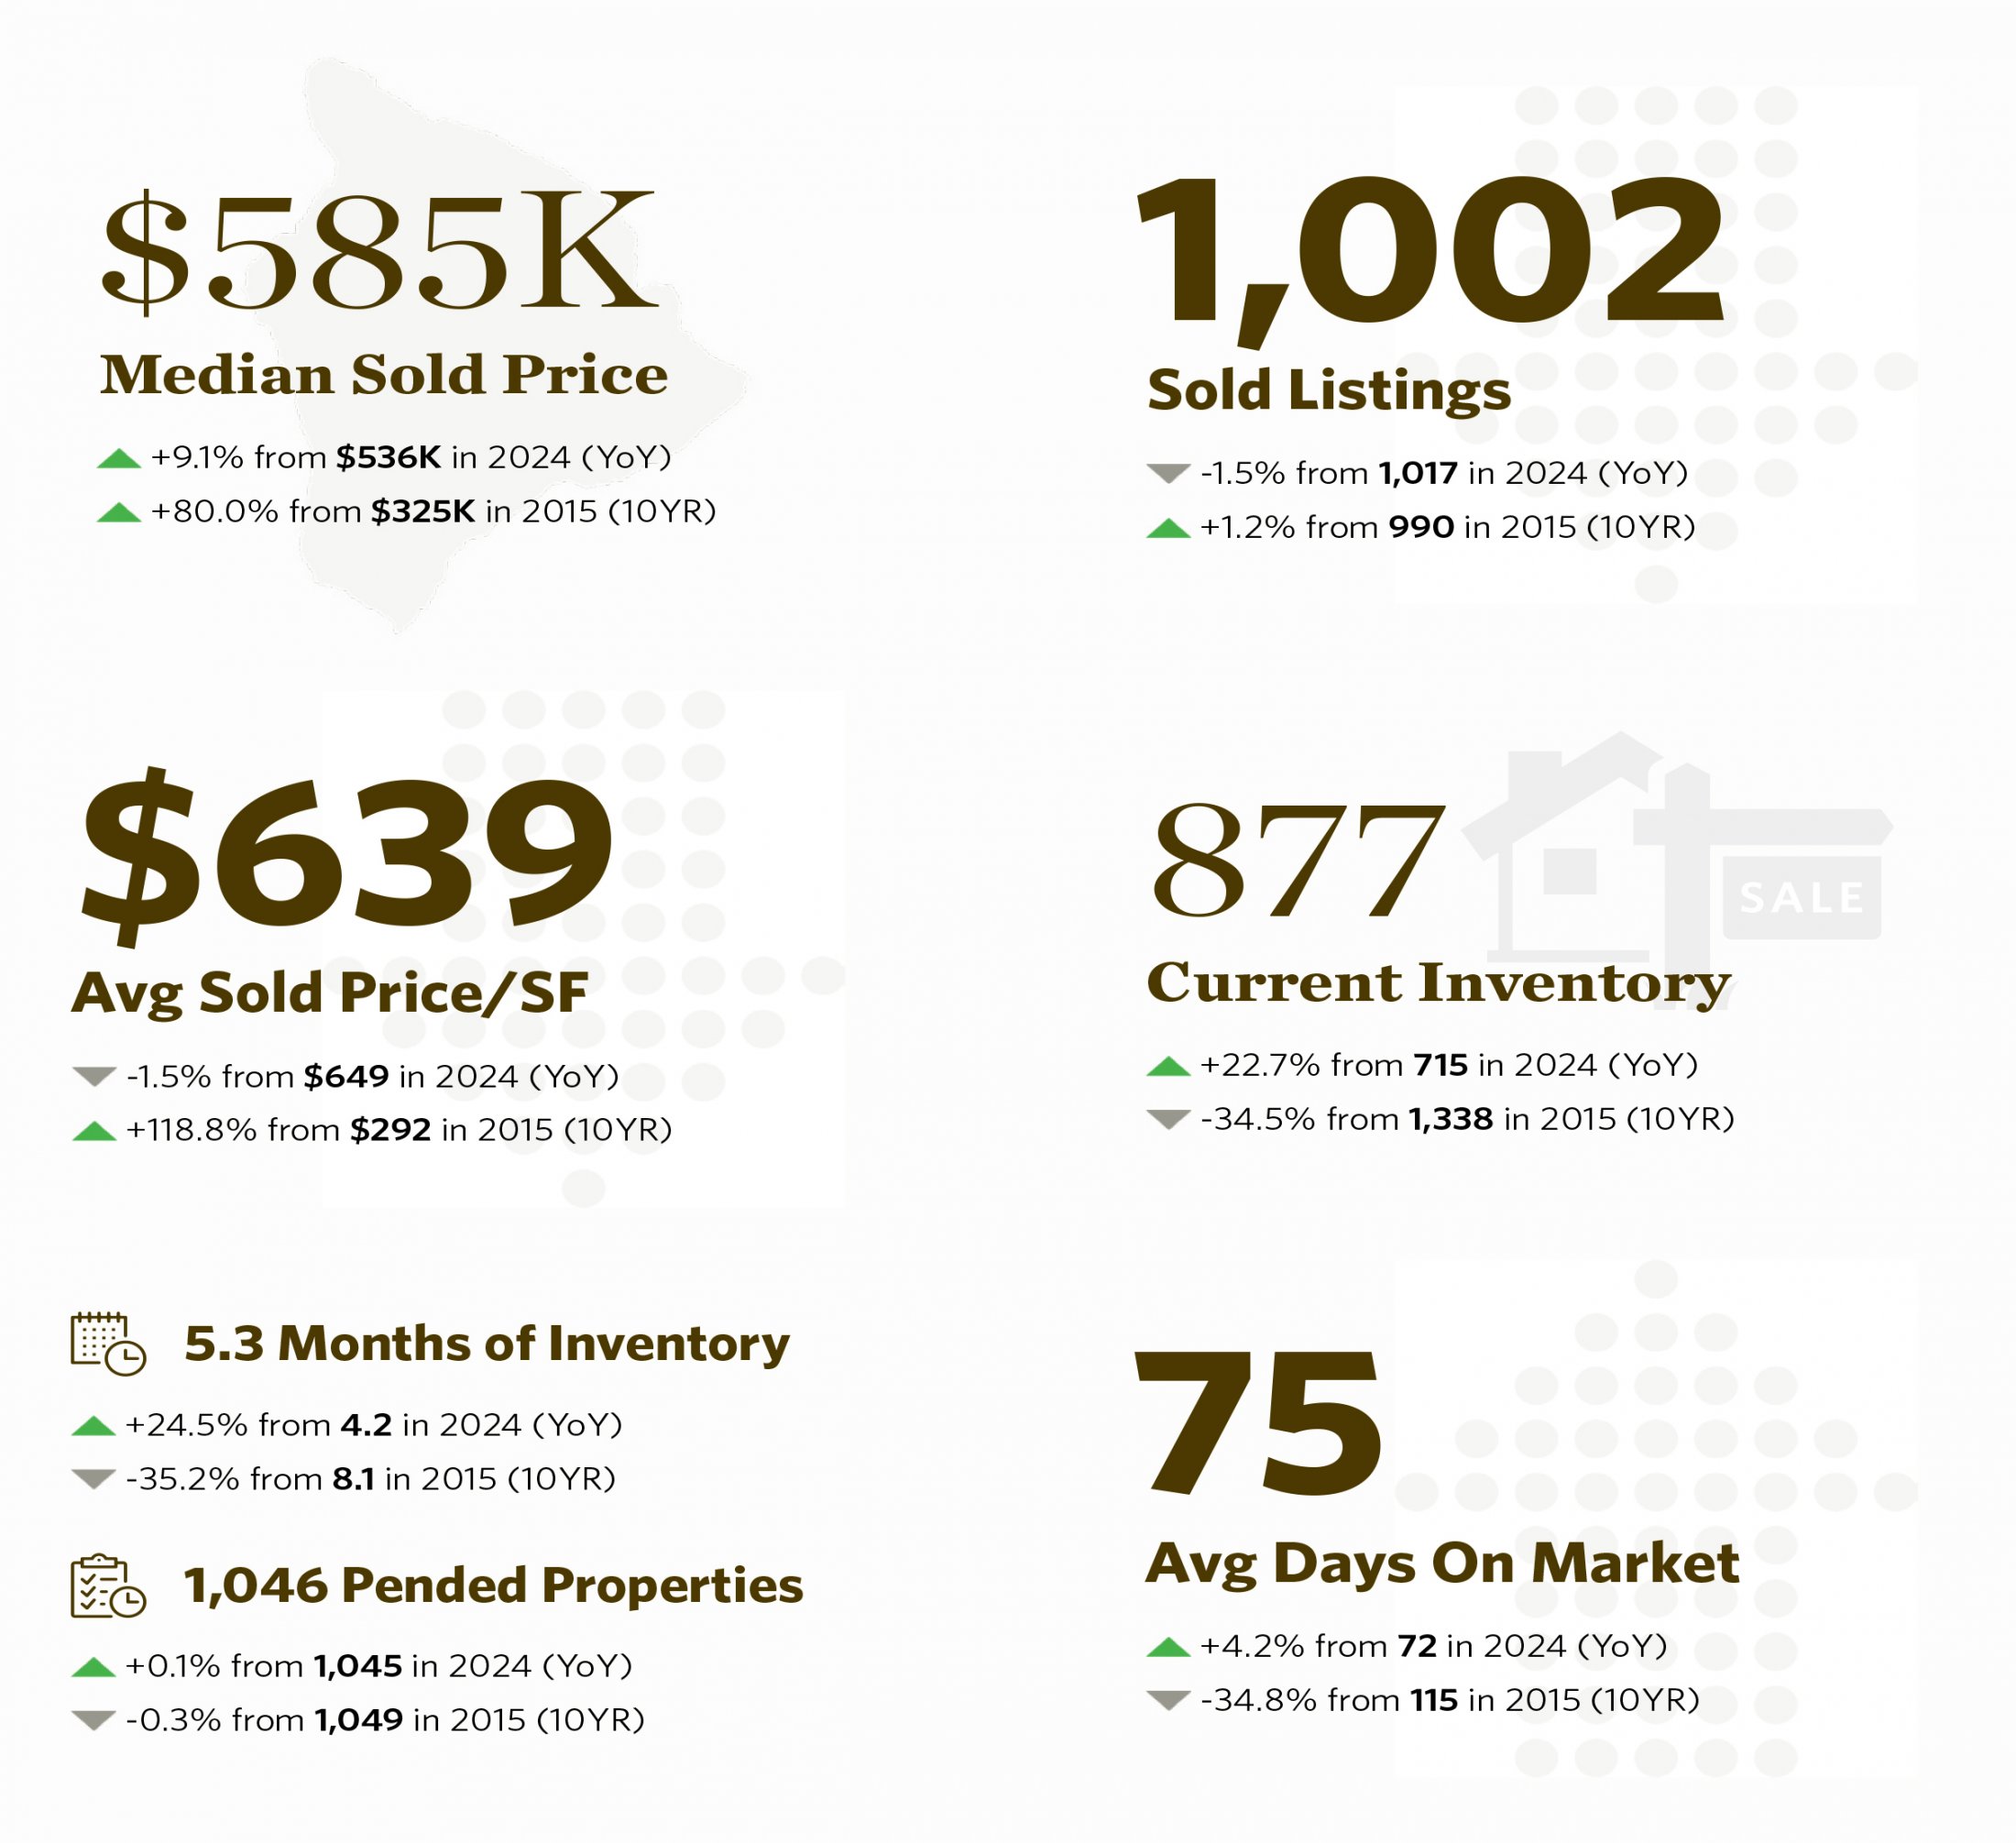
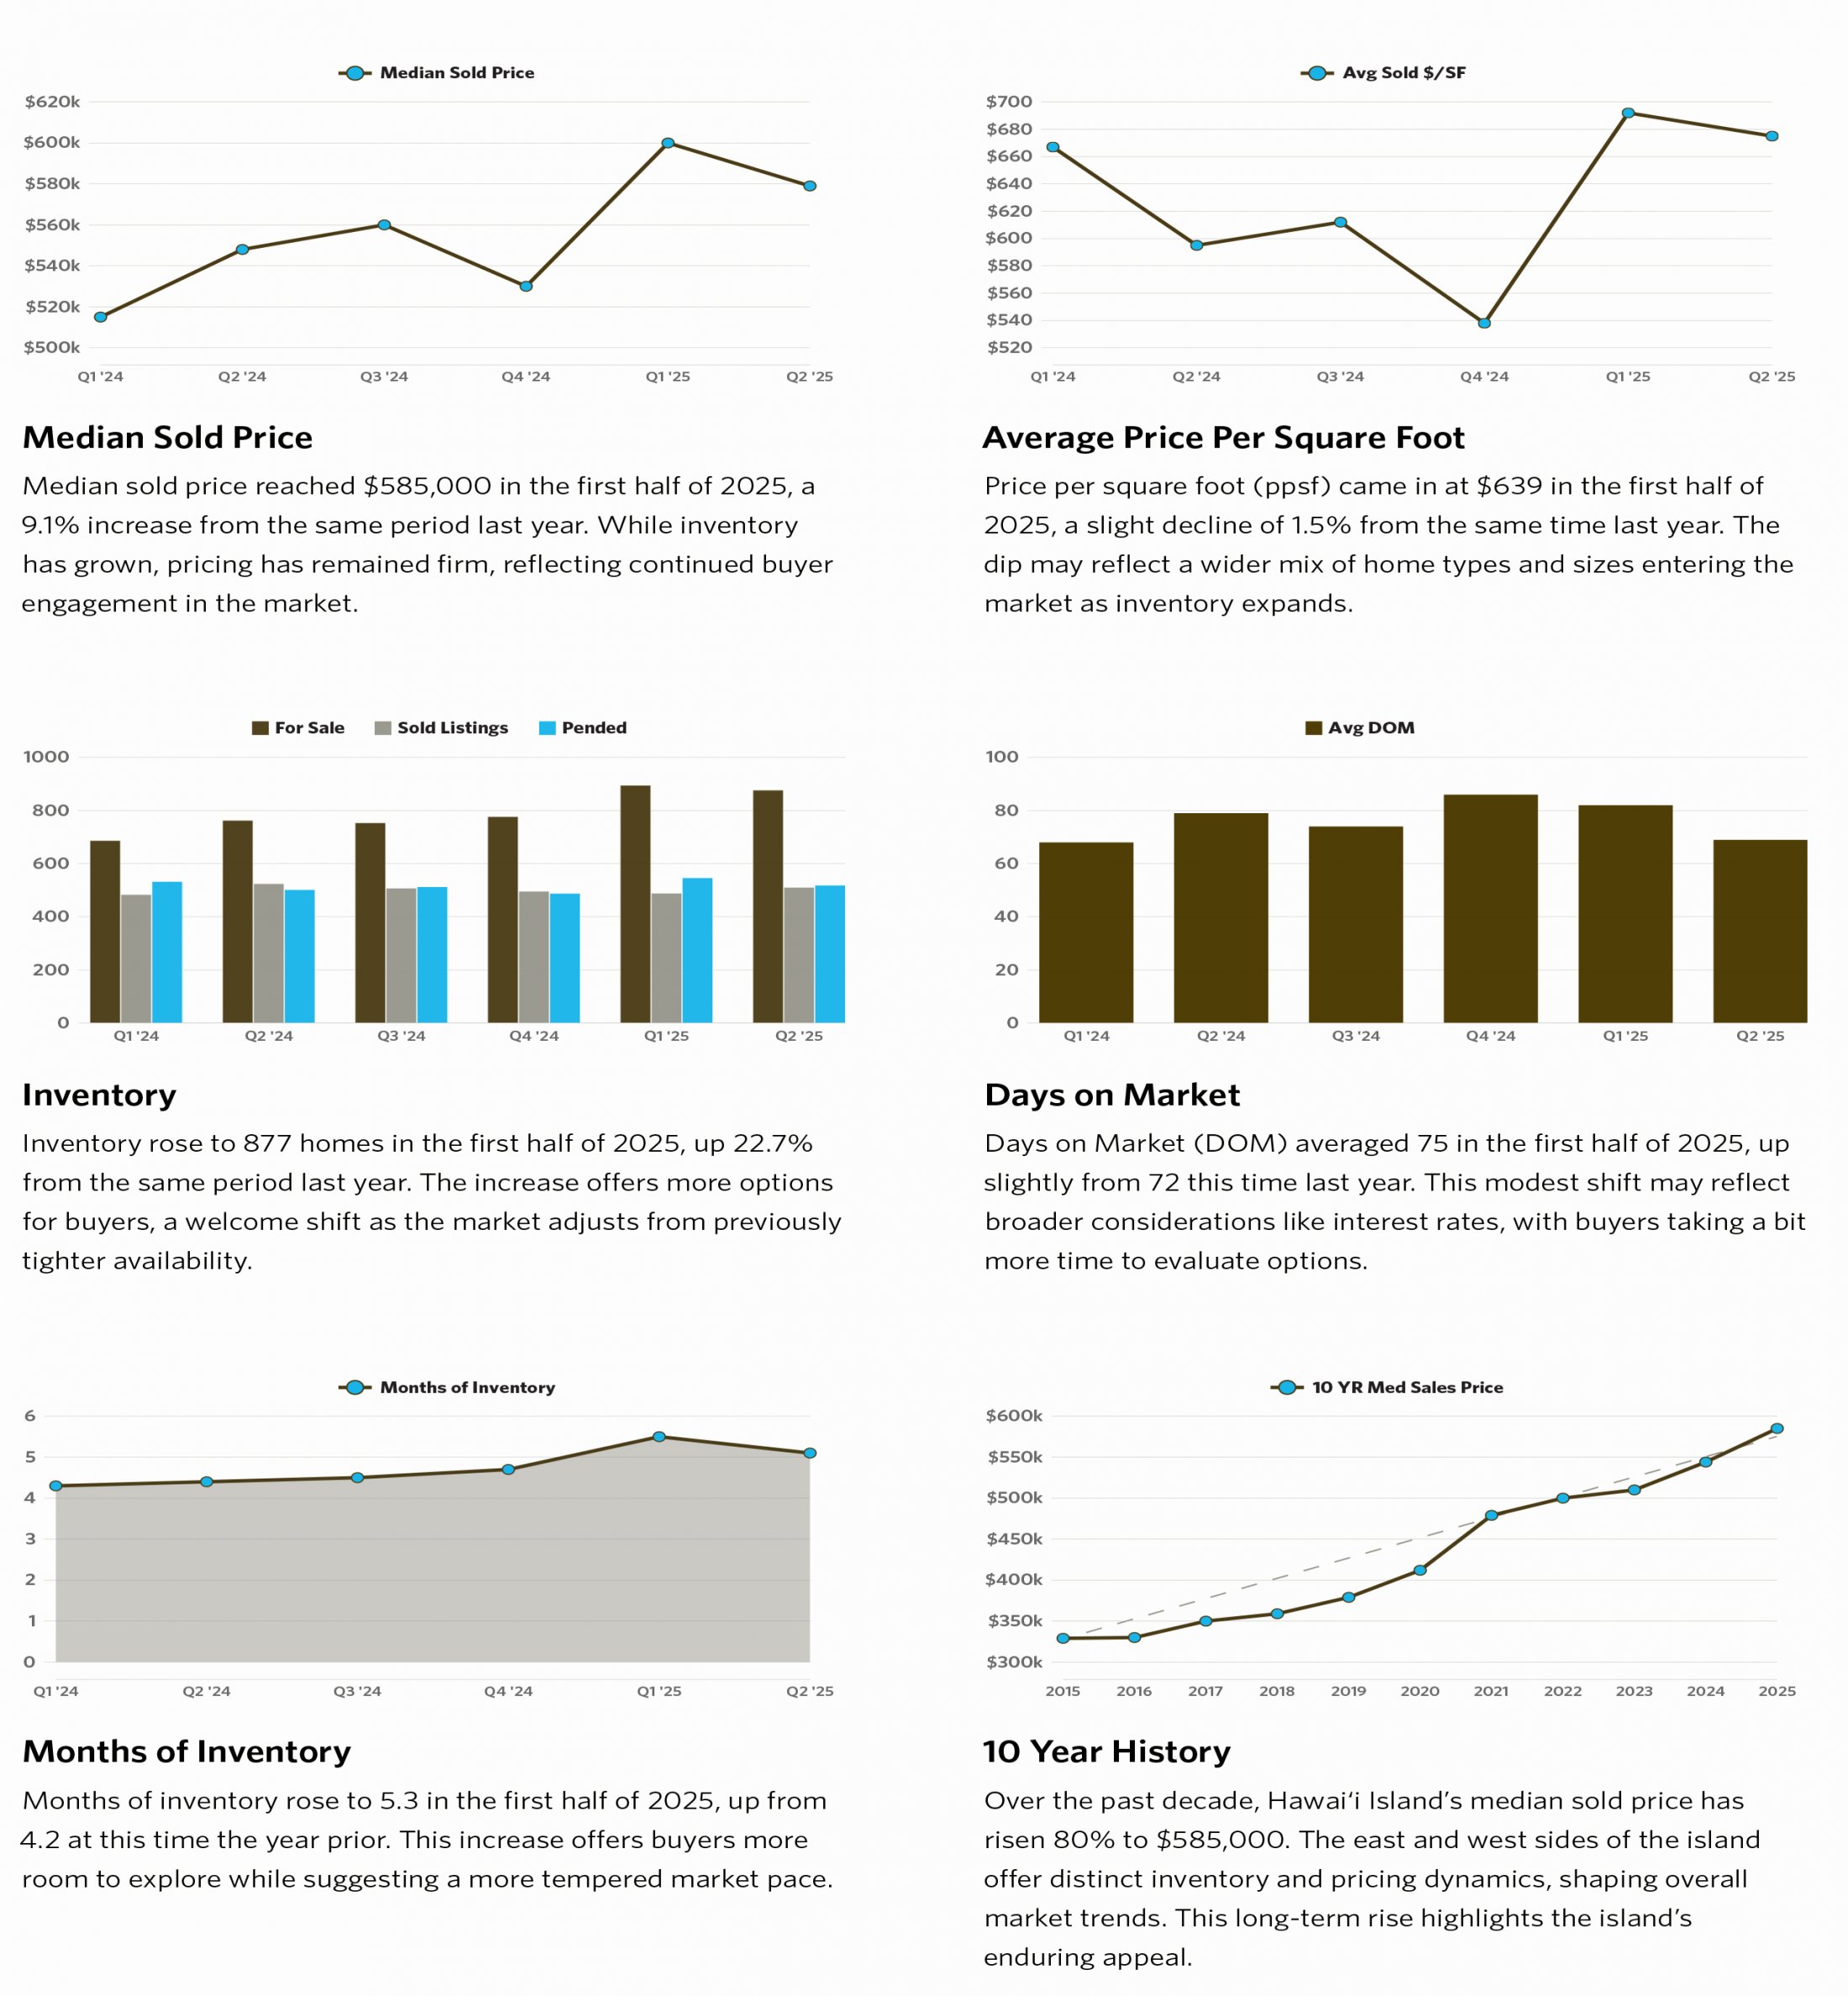
“Median sold price reached $585,000 in the first half of 2025, a 9.1% increase from the same period last year. While inventory has grown, pricing has remained firm, reflecting continued buyer engagement in the market.”
Average Price Per Square Foot
“Price per square foot (ppsf) came in at $639 in the first half of 2025, a slight decline of 1.5% from the same time last year. The dip may reflect a wider mix of home types and sizes entering the market as inventory expands.”
Inventory
“Inventory rose to 877 homes in the first half of 2025, up 22.7% from the same period last year. The increase offers more options for buyers, a welcome shift as the market adjusts from previously tighter availability.”
Days on Market
“Days on Market (DOM) averaged 75 in the first half of 2025, up slightly from 72 this time last year. This modest shift may reflect broader considerations like interest rates, with buyers taking a bit more time to evaluate options.”
Months of Inventory
“Months of inventory rose to 5.3 in the first half of 2025, up from 4.2 at this time the year prior. This increase offers buyers more room to explore while suggesting a more tempered market pace.”
10 Year History
“Over the past decade, Hawai‘i Island’s median sold price has risen 80% to $585,000. The east and west sides of the island offer distinct inventory and pricing dynamics, shaping overall market trends. This long-term rise highlights the island’s enduring appeal.”
Now, let’s compare it to Q1 2025.
Inventory: A Slight Dip from Q1, but Still Elevated
- Q1 2025: 895 homes for sale, 5.5 months of inventory
- Q2 2025: 877 homes for sale, 5.3 months of inventory
After a noticeable jump in Q1, inventory slipped slightly in Q2 but remains much higher than last year. This is creating breathing room for buyers who, just a year ago, were competing in a much tighter market. Sellers now have to adjust strategies—pricing right and presenting their property well matter more than ever.
Sales Volume: Double the Sales of Q1
- Q1 2025: 489 residential sales
- Q2 2025 (YTD): 1,002 residential sales
Sold listings in Q2 were more than double those in Q1, which tells me the market is adjusting to reality. Homes are selling when they’re priced right, and with ample inventory available, there’s no shortage of options for motivated buyers.
Median Sold Price: A Quarter-to-Quarter Softening
- Q1 2025: $600,000 median sold price
- Q2 2025: $585,000 median sold price
While the median price is still up 9.1% year-over-year, it’s actually down compared to Q1. This could mean sellers are starting to meet the market, and buyers are finding more negotiating power, especially in segments with high inventory.
Price per Square Foot: A Notable Drop
- Q1 2025: $692/sf
- Q2 2025: $639/sf
That’s a sharp quarter-to-quarter decline. One possible reason? A broader mix of properties hitting the market, including homes that may need updates, as opposed to the turnkey homes that drove Q1’s higher PPSF.

Sales by Property Type
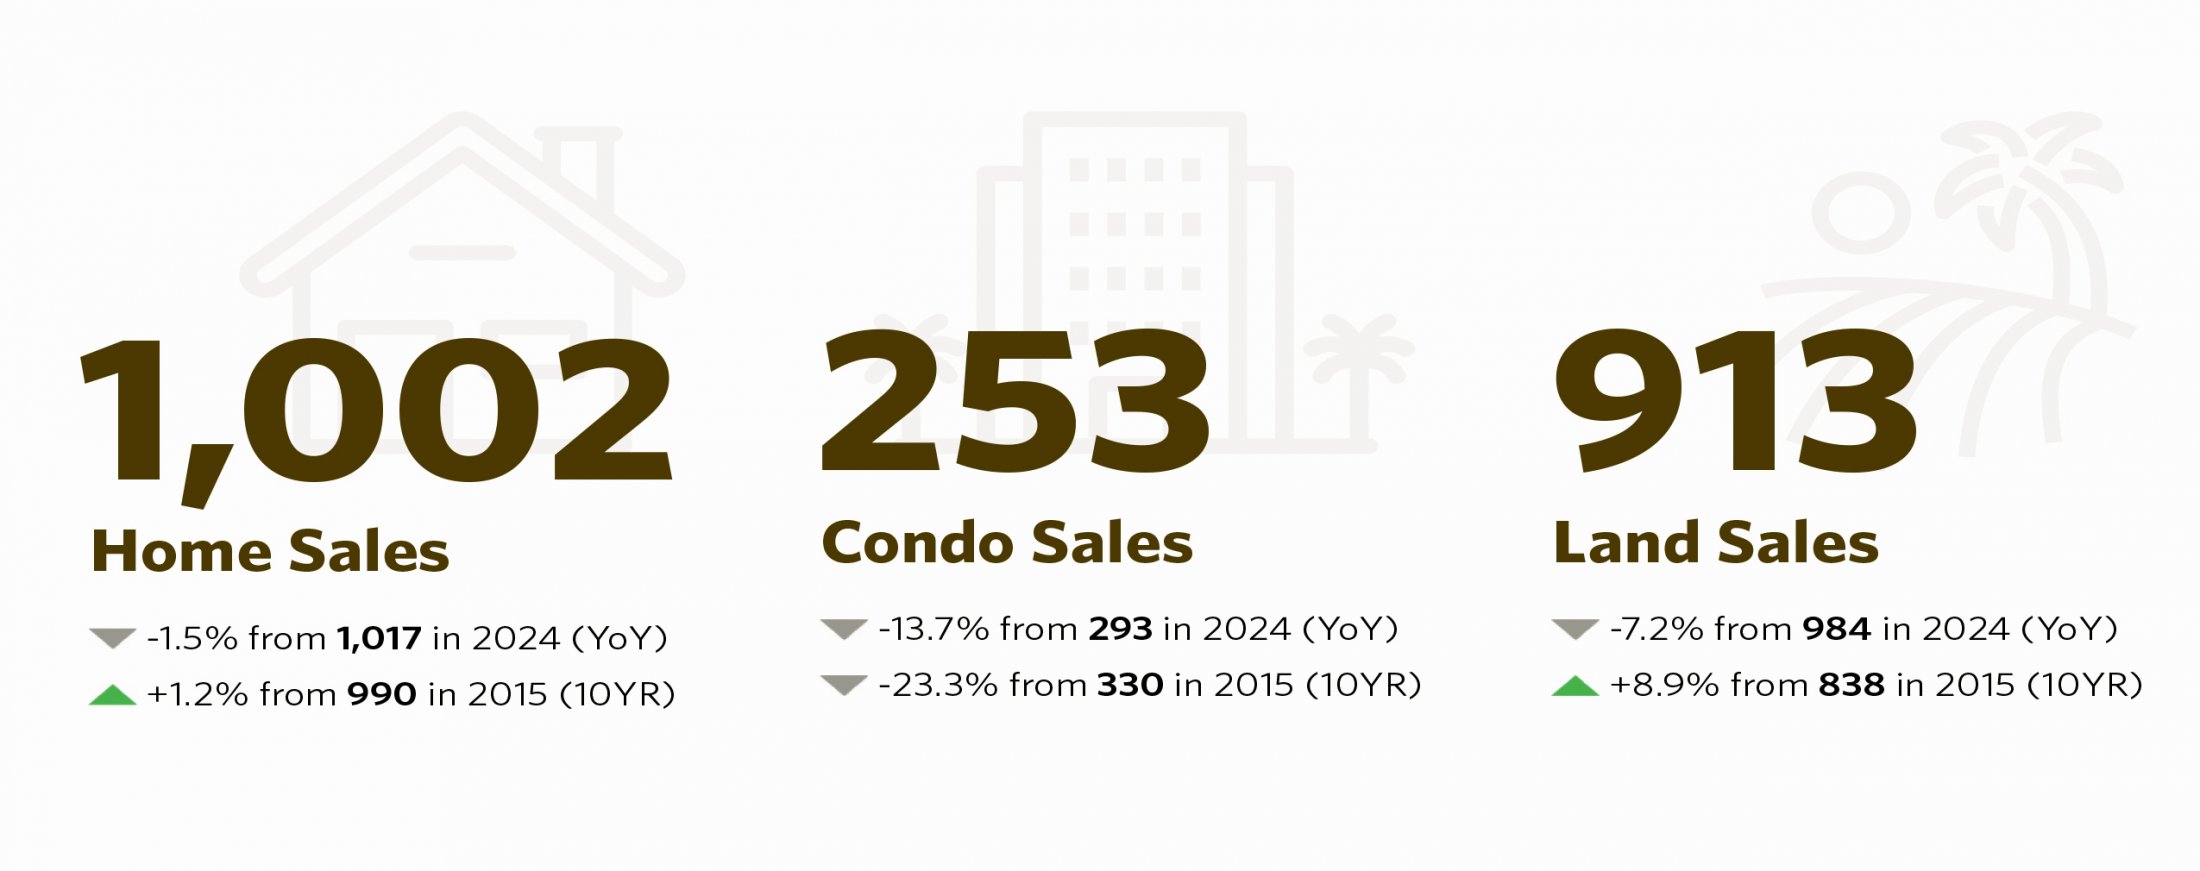
Looking at sales by property type, the Q1 report showed a mixed picture—home and condo sales were slightly up year-over-year, while land sales were down. By Q2, however, all categories saw declines. Residential sales fell 1.5% year-over-year, condo sales dropped 13.7%, and land sales were down 7.2%. This across-the-board slowdown signals that the softer market conditions are not limited to a single segment but are being felt island-wide. Higher inventory and a more deliberate pace from buyers are likely influencing these trends, and sellers in every category are now competing for a smaller pool of active purchasers.
Be sure to check out my latest listing in Puako — great property with an active vacation rental license and expansion potential!
Looking Forward
“The Hawai‘i Island market steadies with options expanding.
Hawai‘i Island’s market is experiencing similar rebalancing seen across the state, as buyers and sellers find their footing in a more even-paced environment. A lift in inventory may give buyers more options heading into the second half.”
What This Means for You
- For Buyers: More inventory and slightly softer prices from Q1 mean there’s less pressure to rush. However, well-priced homes—especially in desirable West Hawai‘i—still move quickly.
- For Sellers: The days of “list high and see what happens” are fading. Competitive pricing, excellent presentation, and a strategic marketing plan are critical to standing out in a growing sea of listings.
- For Investors: The current environment offers opportunities, especially if you’re willing to look at properties that need updates or in emerging areas.
The bottom line: The Big Island market is no longer moving at last year’s lightning pace. We’re in a more balanced phase—one where knowledge, timing, and strategy matter more than ever.
If you’d like to see what these trends mean for your neighborhood or property, let’s talk.
Download the full report here.

Leave your opinion here. Please be nice. Your Email address will be kept private, this form is secure and we never spam you.