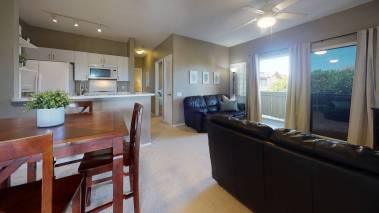
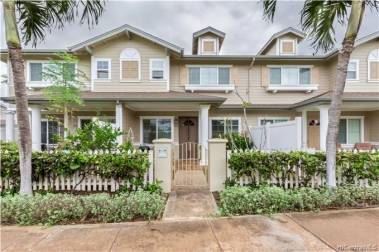
For Sale Just Listed in Ewa Gentry Welcome home to the Sun Rise in Ewa by Gentry. Conveniently located minutes away from Geiger Community Park and the … Kaety Enos February 8, 2022
Oahu NEX Touch ‘N Go West Oahu West Oahu and specifically the Ewa Beach/Kapolei areas continue to grow and expanded almost daily. Very close to the newer … Hawaii Life April 23, 2020
Dining Eateries Offering Takeout At Ka Makana Ali’i | Kapolei, Hawaii Ka Makana Ali’i Now it’s time to support our local eateries during these unprecedented times. The restaurants at Ka Makana … Hawai'i Life March 30, 2020
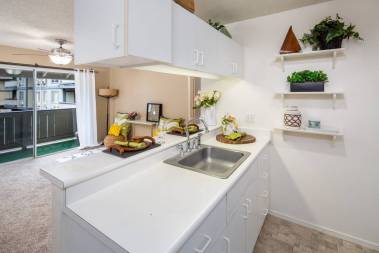
Condos Ewa Beach Condo Just Listed For $315,000 Just listed in Ewa Beach is MLS #202000630, located in the Sun Rise Complex. This 1/1 is being offered at … Hawaii Life January 15, 2020
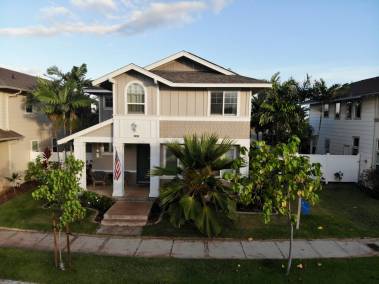
Oahu Newly Listed VA Eligible Home in Ewa Beach It is amazing to me how many military members I meet who are considering renting versus buying in Hawaii. One of … Hawaii Life October 9, 2019
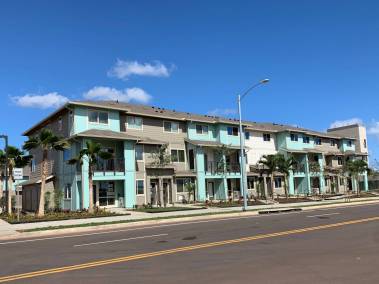
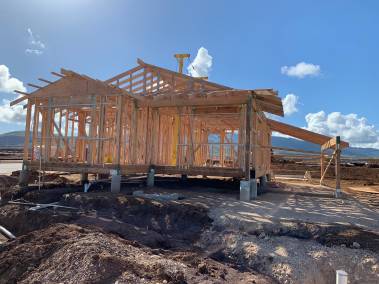
Condos Move-In Time: West Oahu’s First Transit-Oriented Development Move-In Day The first set of excited buyers moved into their brand new homes at Kohina at Ho’opili this month. … Hawaii Life September 30, 2019
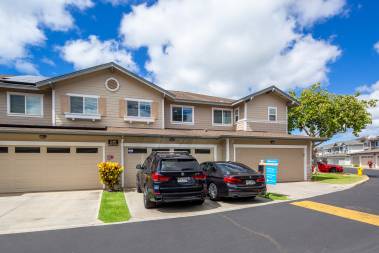
Oahu Spinnaker Place Townhouse with a FULL Driveway MLS #201923031 It sure seems that everyone in Hawaii has a good amount of cars, water toys, and just general stuff. Many … Hawaii Life August 28, 2019
Oahu Ewa Beach is the Place to Live with Two Great Incoming Options Oahu is a very diverse island with entirely different feels, views, and homes. One area that continues to grow in … Hawaii Life August 16, 2019
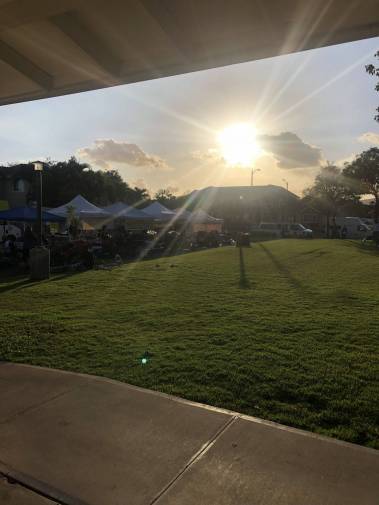
Activities More Reasons to Move to Ewa Beach! The Wednesday Night Food Trucks & Farmers’ Market The Ocean Pointe Community center at 91-6545 Kapolei Parkway in Ewa Beach … Hawaii Life June 24, 2019
Oahu Buying or Selling a Home on Oahu? So you have decided for whatever the reason to sell or buy a new home, now what do you do? … Hawaii Life June 13, 2019
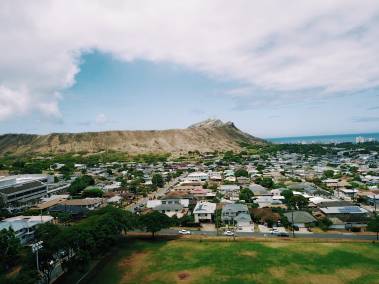
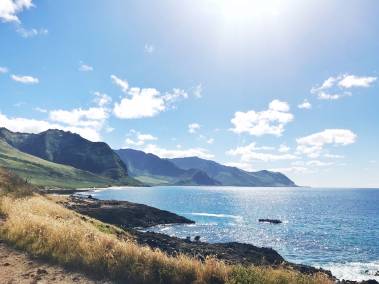
Lifestyle Best Activities on the West Side of Oahu West Oahu can sometimes be overlooked, but it’s truly a wonderful place to live. West Oahu offers some of the … Hawaii Life June 13, 2019
Oahu New Plantation Style Homes on Oahu | Ho’oulu at Ho’opili Ho’oulu at Ho’opili Anyone who has read any of my blogs knows that I am not only a fan of … Hawaii Life May 9, 2019